

Gallup has a poll that asks Americans what income strata they belong in.
The results are relatively stable over the past 20+ years:
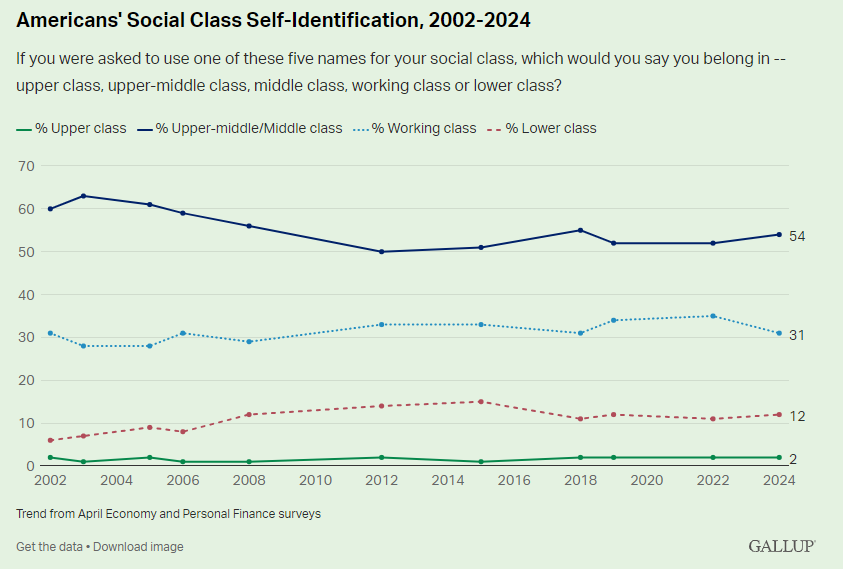
Most people say middle class while very few people think they are upper class.
The Pew Research Center has a new tool that allows you to enter your income and see where it is you fit both nationally and locally.
Their numbers show the Gallup poll is right on the money as far as middle-class figure goes but not even close on the percentage of people in the upper class:
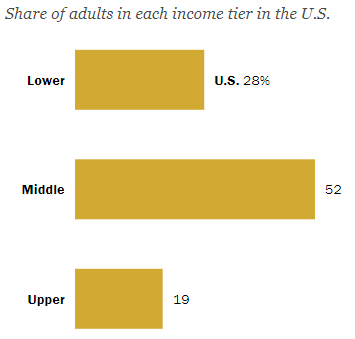
Just 2% of people feel they are in the upper class but nearly 20% actually reside there.
There used to be a greater share of people in the middle class.
In 1971, 61%of Americans were middle class while just 11% were considered upper class. The lower-income cohort made up 27% of the total back then so we’ve seen a healthy shift from the middle to upper class over the past 50 years or so.
Decreasing the share of lower-income households would be nice, but this is progress.
These are the income breakpoints from Pew:
- Lower income = Less than $56,600
- Middle income = $56,600 to $169,800
- Upper income = More than $169,800
Like all averages, these numbers could use some context. It depends on where you live, the cost of living, job opportunities, etc.
For example, using the Pew middle-class calculator, I entered my metro area in West Michigan to see where we stack up relative to the national averages:
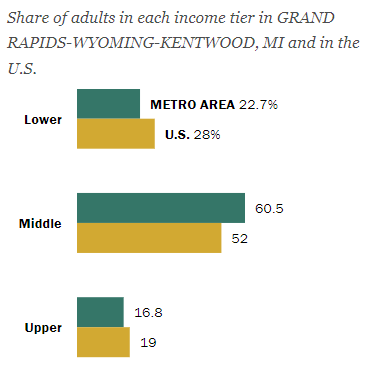
There are more people in the middle class and fewer in the lower and upper classes. That checks out based on my experience.
Now look at the New York City metro area:
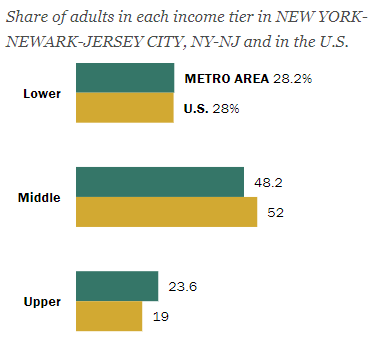
Fewer people in the middle-class and a higher-than-average share in the upper class.
Obviously, New York City has a much higher standard of living than Grand Rapids does. Everything is more expensive.
I would guess many people who technically fall into the upper class in New York City would identify as middle class because of how expensive it is to live there. I don’t blame them.
The same idea applies to the housing market.
Apartment List published a chart that shows homeownership by generation at different ages:
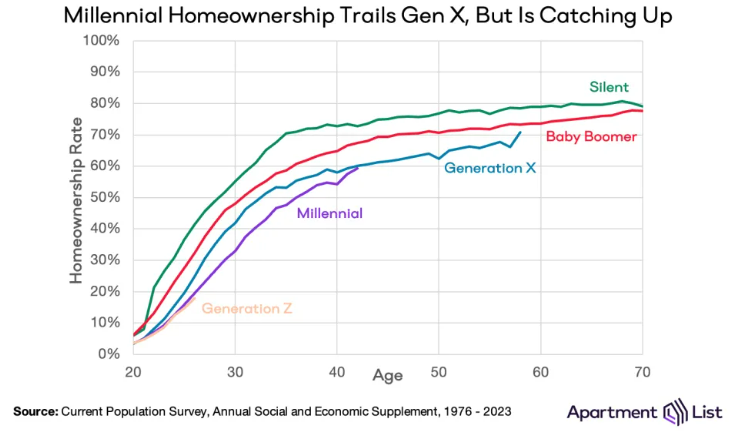
Millennials are more or less on track with previous generations even though we’ve been playing catch-up.
That’s the good news.
But the homeownership rate is not evenly distributed across the country:
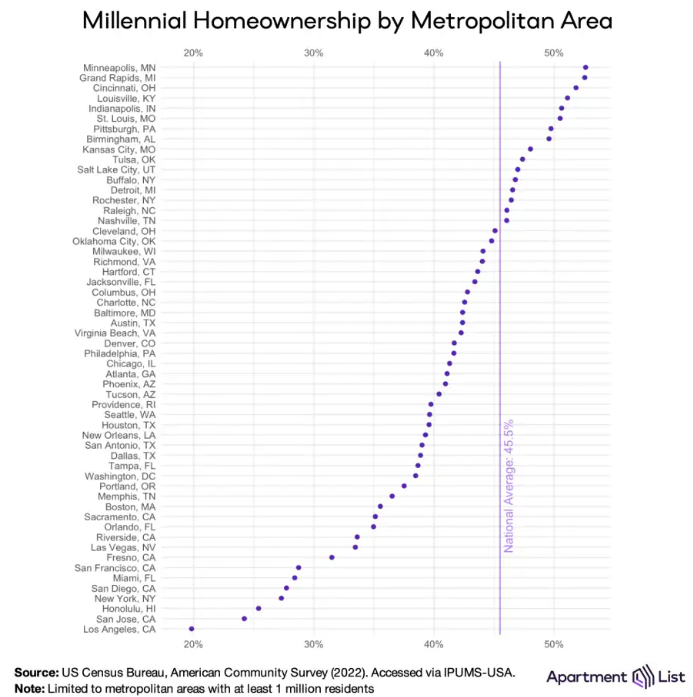
Millennials are far more likely to own a home in the midwest than on the coasts. Grand Rapids is near the top of the list for homeownership rates. Look at how much lower the rates are for all of the big cities in California at the bottom of the list.
Homeownership rates for young (and, gulp, middle-aged) people are much higher in non-metro areas than in big cities. This makes sense from a cost perspective but also changes how you view your financial standing depending on where you live.
There are certainly people who live in New York City and Los Angeles who make upper-class incomes but feel like they cannot afford to buy a home.
On the other hand, there are middle-class households who live like they have upper-class incomes, buying $80k SUVs and taking summer vacations to Europe.
This is why finance is more than numbers.
Your relationship with money is shaped not only by where you live but also by your peers, your parents, how you were raised, your history with money, how much you make, how much you spend, and your emotional make-up.
Income is one thing.
What you do with that income is what really matters.
Further Reading:
Rich vs. Wealthy
This content, which contains security-related opinions and/or information, is provided for informational purposes only and should not be relied upon in any manner as professional advice, or an endorsement of any practices, products or services. There can be no guarantees or assurances that the views expressed here will be applicable for any particular facts or circumstances, and should not be relied upon in any manner. You should consult your own advisers as to legal, business, tax, and other related matters concerning any investment.
The commentary in this “post” (including any related blog, podcasts, videos, and social media) reflects the personal opinions, viewpoints, and analyses of the Ritholtz Wealth Management employees providing such comments, and should not be regarded the views of Ritholtz Wealth Management LLC. or its respective affiliates or as a description of advisory services provided by Ritholtz Wealth Management or performance returns of any Ritholtz Wealth Management Investments client.
References to any securities or digital assets, or performance data, are for illustrative purposes only and do not constitute an investment recommendation or offer to provide investment advisory services. Charts and graphs provided within are for informational purposes solely and should not be relied upon when making any investment decision. Past performance is not indicative of future results. The content speaks only as of the date indicated. Any projections, estimates, forecasts, targets, prospects, and/or opinions expressed in these materials are subject to change without notice and may differ or be contrary to opinions expressed by others.
The Compound Media, Inc., an affiliate of Ritholtz Wealth Management, receives payment from various entities for advertisements in affiliated podcasts, blogs and emails. Inclusion of such advertisements does not constitute or imply endorsement, sponsorship or recommendation thereof, or any affiliation therewith, by the Content Creator or by Ritholtz Wealth Management or any of its employees. Investments in securities involve the risk of loss. For additional advertisement disclaimers see here: https://www.ritholtzwealth.com/advertising-disclaimers
Please see disclosures here.