

Studying market history has made me a better investor.
Calculating historical performance data is one of my go-to moves for this blog. It helps provide some insight into the potential risks and range of outcomes in the markets.
Market history also helps keep you grounded.
It’s important to understand the booms and busts — the South Sea Bubble, the panic of 1907, the roaring 20s, the Great Depression, the Nifty Fifty, the great inflation of the 1970s, the 1987 crash, the Japanese asset bubble of the 1980s, the dot-com boom & bust, the Great Financial Crisis and more.
These periods help define the human condition — from fear to greed, panic to euphoria, jealousy to the fear of missing out and more.
But market history requires context and perspective. It can help you prepare but it’s not a foolproof way to predict what comes next.
As Warren Buffett once wrote, “If past history was all that is needed to play the game of money, the richest people would be librarians.”
For example, thinking through the current economic regime has been difficult for investors and pundits alike.
In 2022, everyone assumed a recession was a foregone conclusion based on historical analogues (inverted yield curve, high inflation, etc.). It didn’t happen.
Now inflation seems like it’s under control and the Fed is cutting rates with the stock market at all-time highs.
And it feels like this means either the coast is clear or we’re on the verge of a collapse.
It’s hard to believe but we have been in this situation before (kind of).
I had our research team look at the forward 12-month returns from every initial Fed rate cut since 1957:
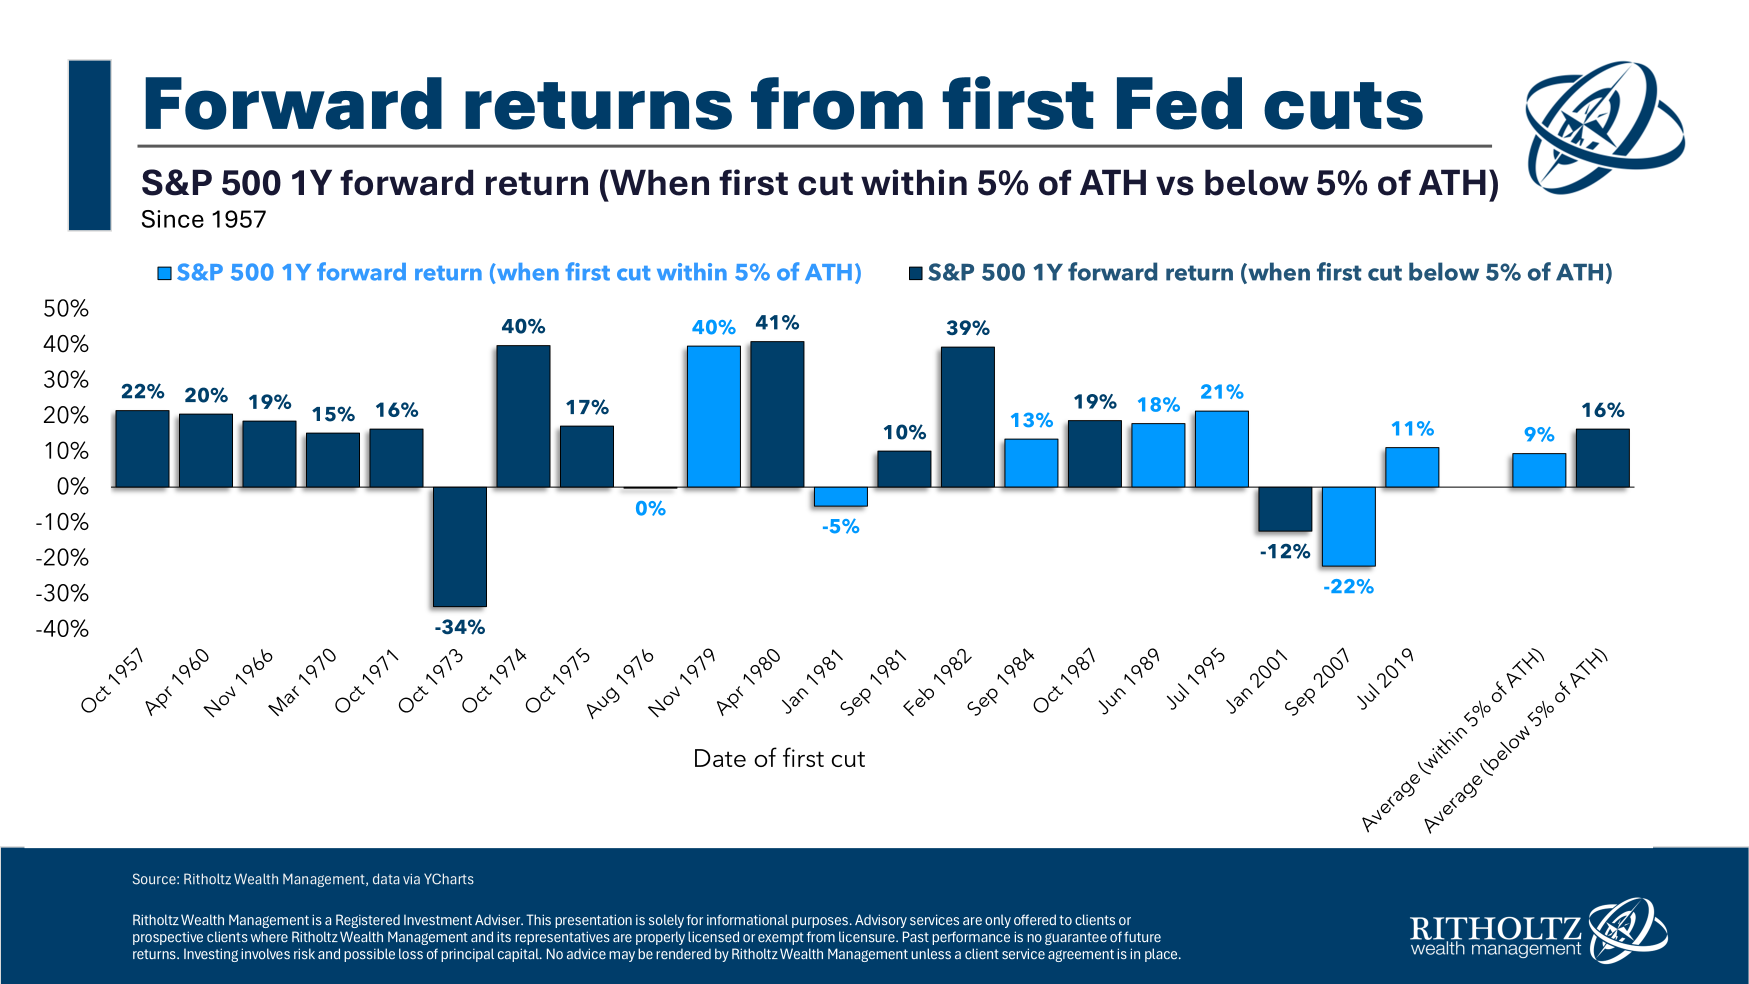
You can also see a breakdown of whether that initial rate cut came when the market was within 5% of all-time highs or not.
The one-year returns following the first Fed rate cut have been pretty good.
The average returns are, well, average. And five out of seven times when the Fed started cutting rates near all-time highs, the market was higher 12 months later.
Here’s the same breakdown showing three-year forward returns:
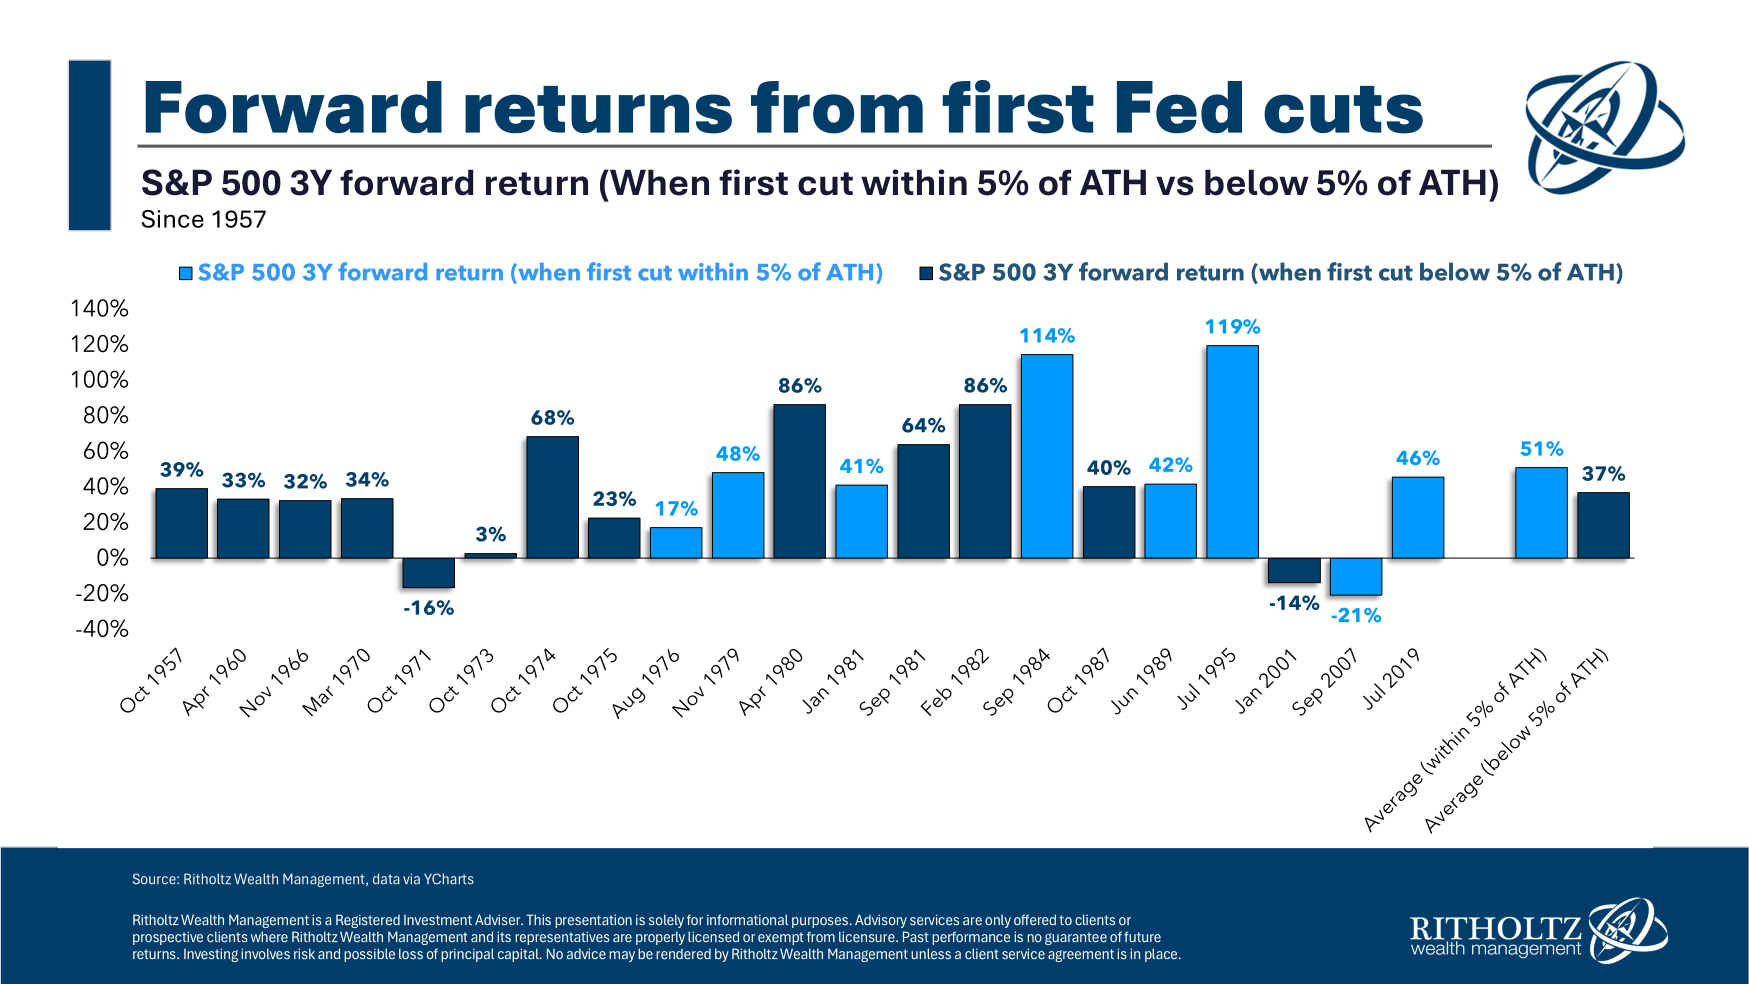
Again, pretty good. Six out of seven times the stock market was higher 36 months later when the market was close to all-time highs.
This is good news for investors. Most of the time, things have worked out just fine when the Fed cuts rates close to all-time highs.
This makes sense intuitively, too. Easier monetary policy should be good for corporations.
However, I’m also want to offer some caution when thinking about what comes next in the current iteration. We’ve never truly seen anything like the current environment.
Here’s an incomplete list of what makes this situation unique:
- We’re still normalizing from the pandemic.
- There were trillions of dollars in government spending.
- The stock market has been in a ~15 year bull market.
- Interest rates have been all over the map.
- The U.S. has experienced just two months of recession since June 2009.
Plus, there is the fact that the Federal Reserve has never been more transparent than it is today. Investors in the past had to guess what the Fed thought. Now, they won’t shut up about it.
The truth is I don’t know.
It’s helpful to know that Fed rate cuts at and around all-time highs haven’t spelled doom in the past.
But it’s also true that the stock market has been up more often than not over most 12- and 36-month periods historically.
History is helpful up to a point but things that have never happened before seem to happen all the time these days.
Human nature is the one constant across all market and economic cycles but humans are highly unpredictable.
For that reason, markets are unpredictable too.
Further Reading:
The Stock Market Never Changes