

The Black Hat Network Operations Center (NOC) provides a high-security, high-availability network in one of the most demanding environments in the world: the Black Hat event.
The NOC partners are selected by Black Hat, with Arista, Cisco, Corelight, Lumen, NetWitness and Palo Alto Networks delivering from Las Vegas this year. Cisco is the official Domain Name Service, Malware Analysis and Mobile Device Management provider. The Meraki team is writing a blog about the experiences in protecting and managing the Black Hat mobile devices.
The partners also provide integrated security, visibility and automation: a Security Operations Center (SOC) inside the NOC, with Grifter ‘Niel Wyler’ and Bart Stump as the leaders.
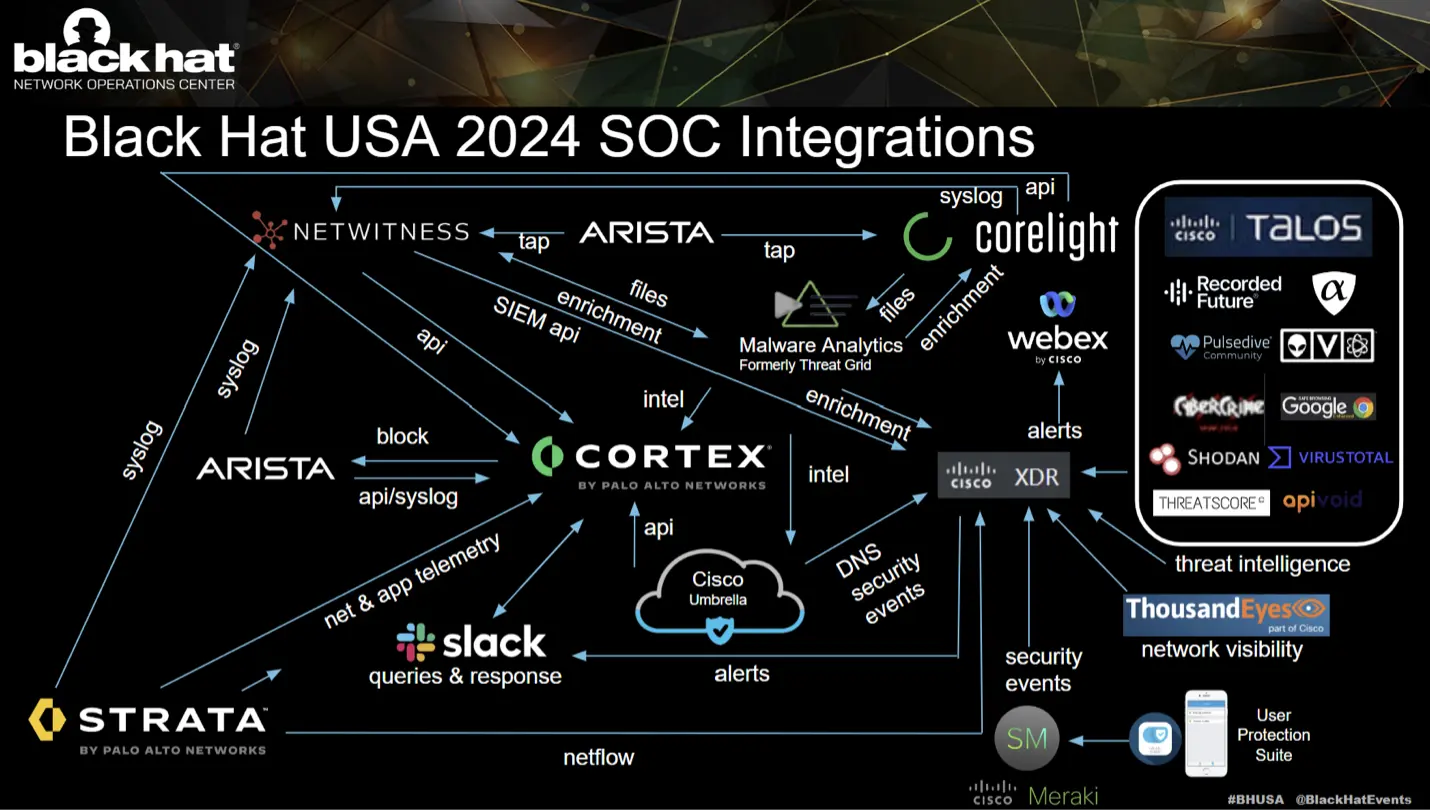
Integration is key to success in the SOC of the NOC. At each conference, we have a hack-a-thon to create, prove, test, improve and finally put into production new or improved integrations. To be a NOC partner, you must be willing to collaborate, share Automated Programming Interface (API) keys and documentation, and come together (even as market competitors) to secure the conference for the good of the attendees.
XDR integrations
Cisco joined the Black Hat NOC in 2016, when asked to provide automated malware analysis with Threat Grid. The Cisco contributions to the network and security operations evolved, with the needs of the customer, to include more components of the Cisco Security Cloud:
The NOC leaders allowed Cisco (and the other NOC partners) to bring in additional software to make our internal work more efficient and have greater visibility. However, Cisco is not the official provider for Extended Detection & Response (XDR), Network Detection & Response or Collaboration.
- Cisco XDR: Network Traffic Visibility and Threat Detection/Threat Hunting/Threat Intelligence Enrichment/Executive Dashboards/Automation
- Cisco Webex: Incident notification and team collaboration
The Cisco XDR command center dashboard tiles made it easy to see the status of each of the connected Cisco Security technologies, the overall threat landscape and the status of network availability as monitored by ThousandEyes agents.
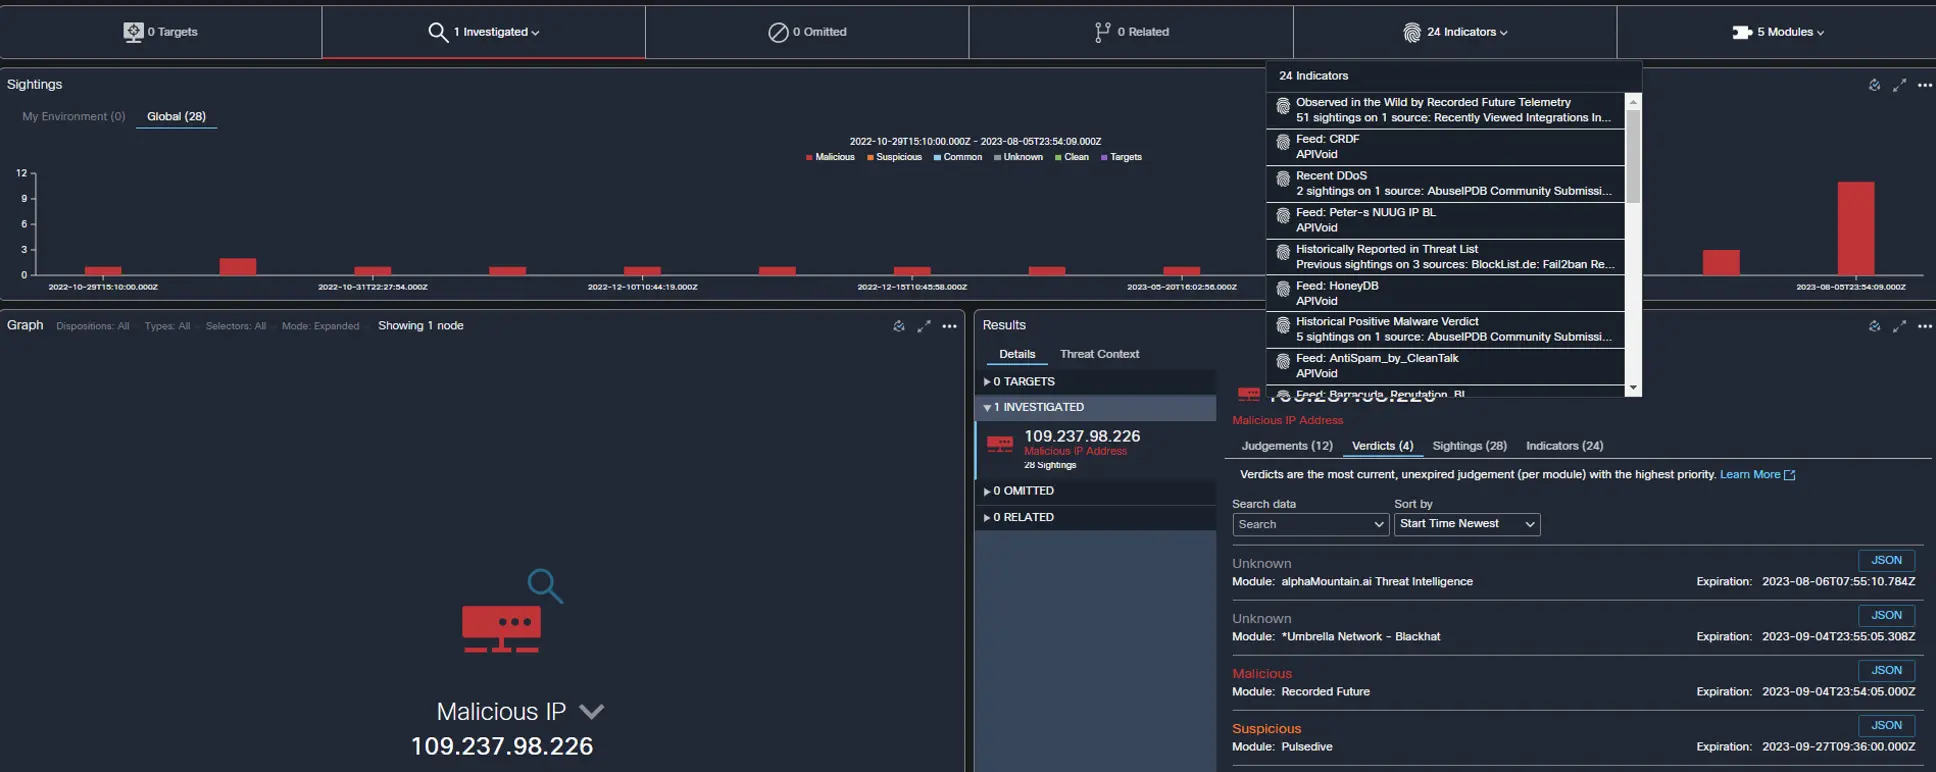
Below are the Cisco XDR integrations for Black Hat USA, empowering analysts to investigate Indicators of Compromise (IOC) very quickly, with one search. We appreciate alphaMountain.ai, Pulsedive and Recorded Future donating full licenses to the Black Hat USA 2024 NOC. Also, check out the blog on XDR turning one year old and the influence of Black Hat events.
One of the new integrations this year was with a utility written by one of our SOC team members. Every security professional — especially SOC analysts and responders — have a series of “quick lookup” style tools that they use to answer various questions about artifacts in an investigation. Shodan is a great example; “given an IP address, what services is that IP providing, and what software are they using to provide it?”. Paste the IP into Shodan, and you will likely get your answer. With the Shodan integration in XDR, you don’t even have to copy and paste — just click the IP and then in the drop down menu, click the Shodan link. But there are hundreds of such tools…
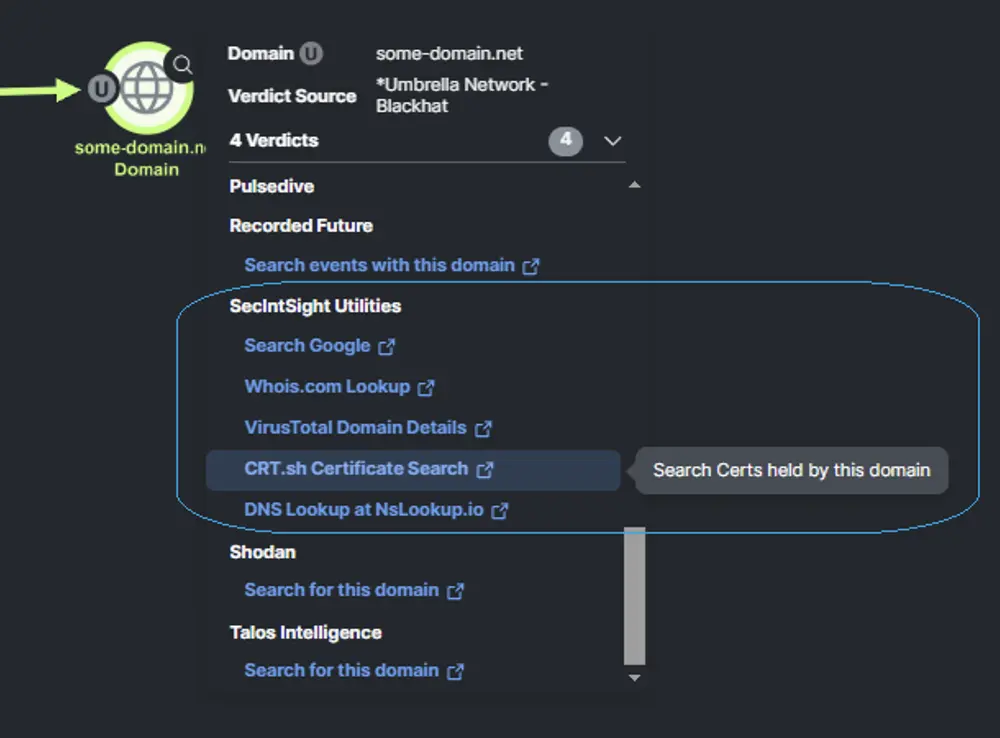
Ben took one of the integration server templates that Cisco Security published on Github and modified it to our needs. He then hosted it on his cloud provider of choice, added it to our XDR configuration and could add these simple pivots to XDR on the fly. A simple edit of a text file on the server and we could jump from any observable to any new relevant reference site that anyone had suggested.
Cisco XDR is built on the ideals of an open integration framework, with published data models, API specifications and sample code available to be modified or used as examples/tutorials (along with actual tutorials at DevNet). This commitment to extensibility allows for modifications such as the above without requiring any action from the XDR development or product teams, allowing customers to tailor XDR to their unique needs.
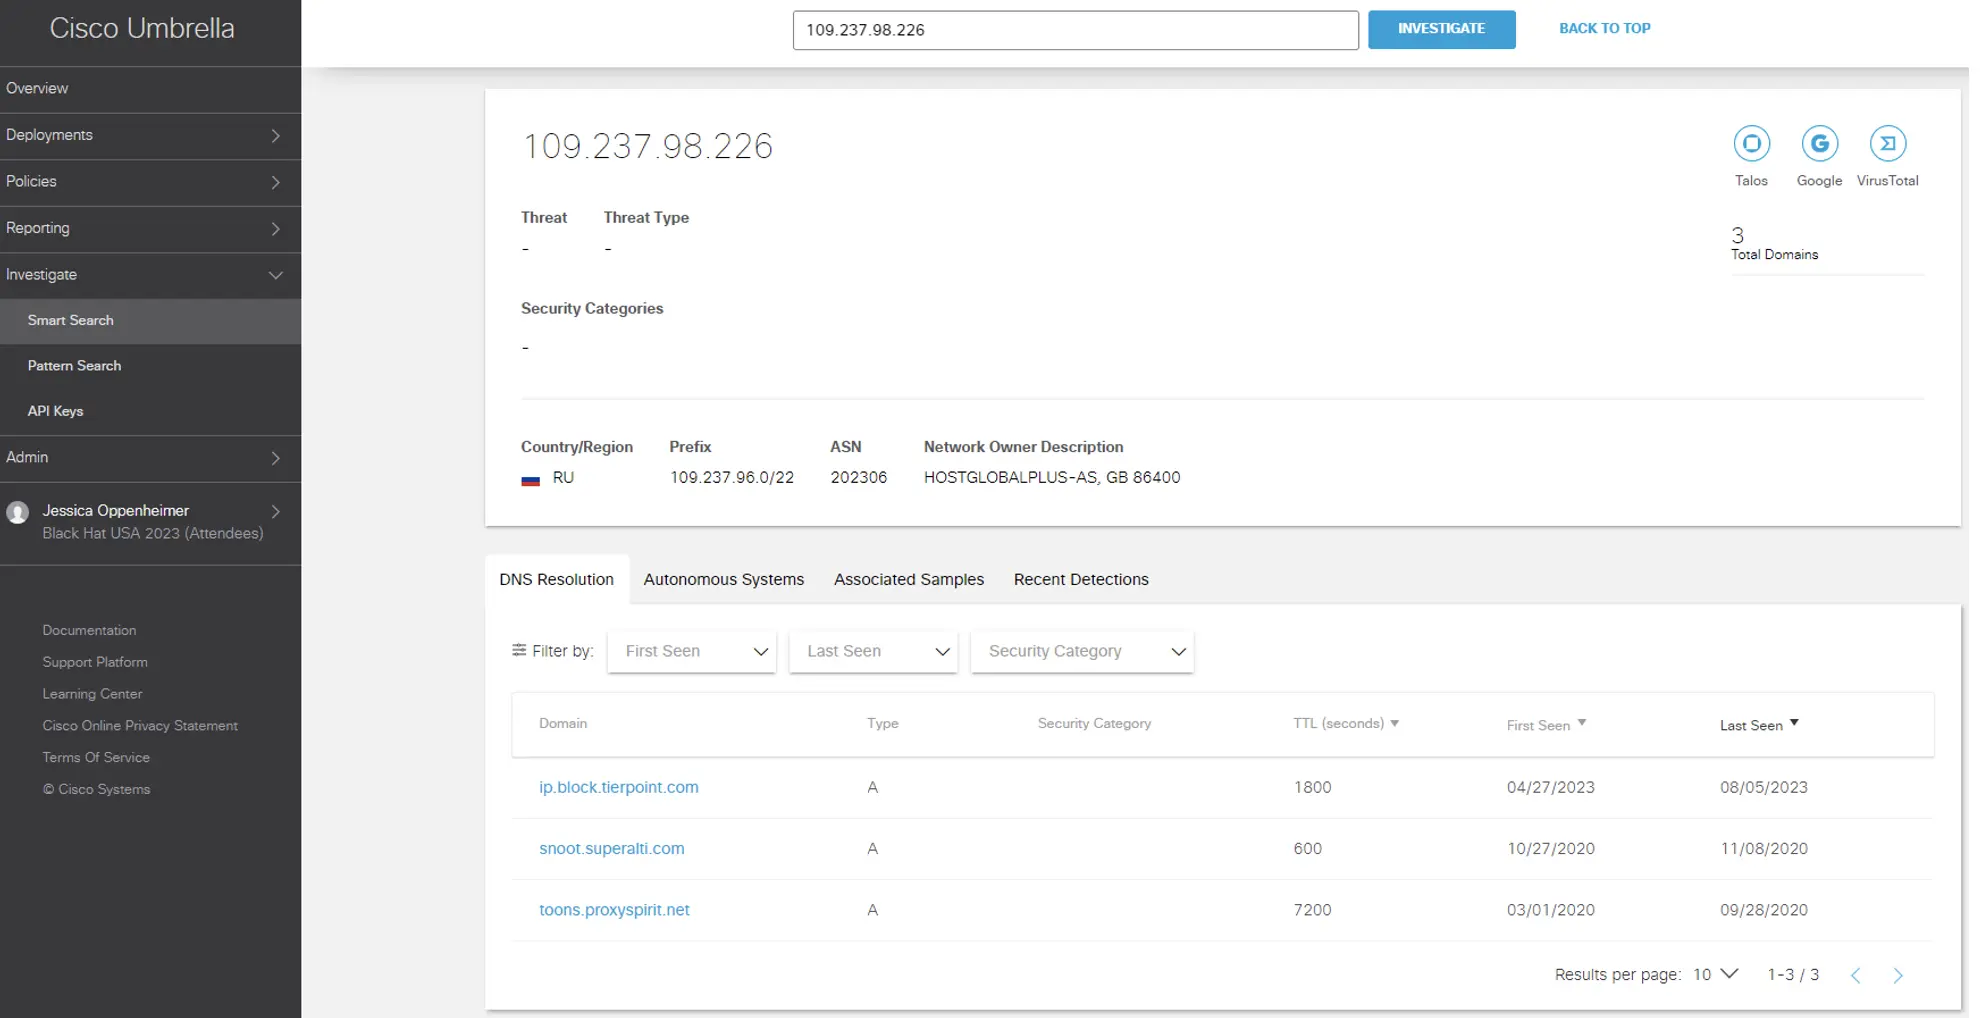
For example, an IP tried <AndroxGh0st> Scanning Traffic against the Registration Server, blocked by the Palo Alto Networks firewall.
Investigation of the IP confirmed: It was known malicious.
Also, the geo location is in RU and known affiliated domains. With this information, the NOC leadership approved the shunning of the IP.
XDR: Asset visibility
By: Ben Greenbaum
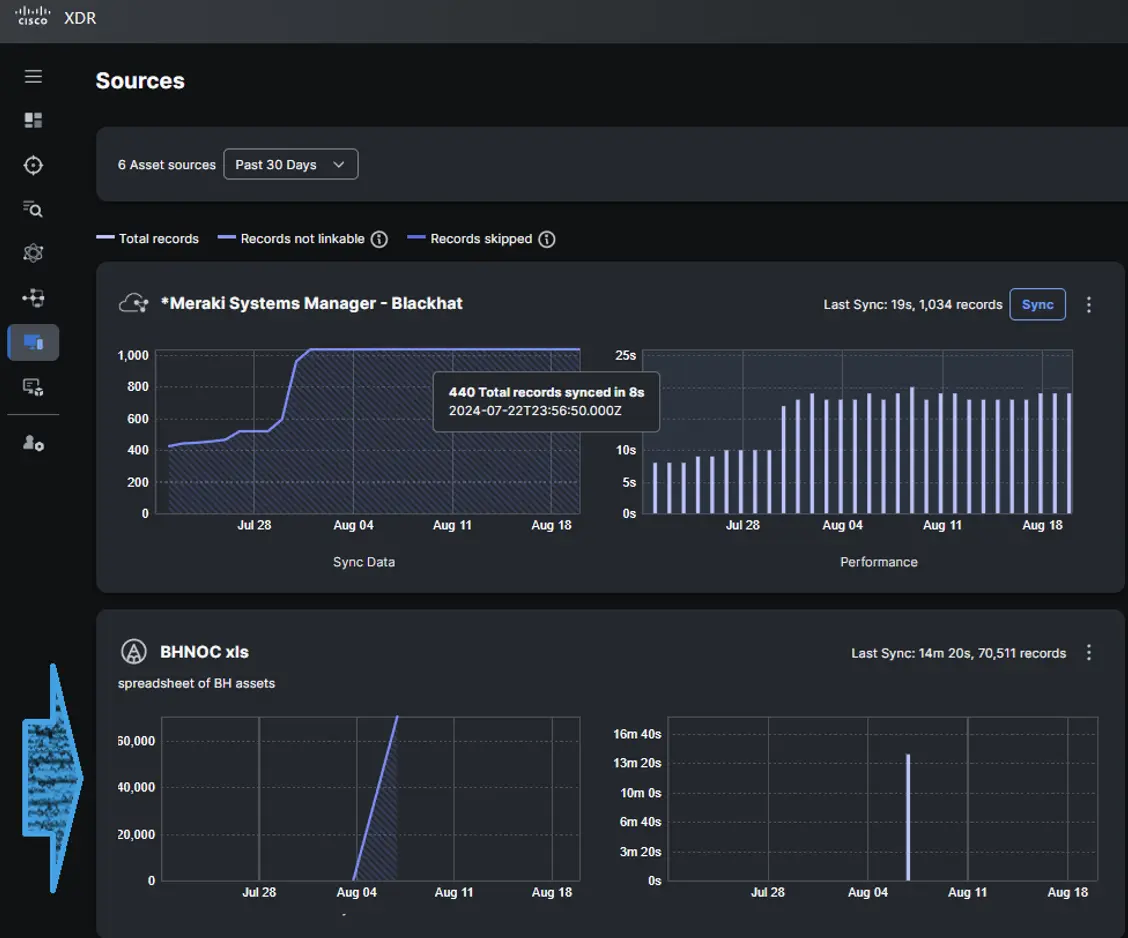
As the Black Hat network evolves, different vendors are given opportunities to bring their products into the toolbox. As a result of this ongoing cycling, we did not have access to the depth of intelligence previously provided by deployment of a Meraki wireless infrastructure. However, due to the capability built into XDR Asset Insights to upload a custom CSV file of assets, we were able to easily operationalize known network topography into investigative and response operations.
One of the unique challenges of the Black Hat environment is how different it is from a “normal” customer’s production network. We have a few hundred devices whose protection is our primary goal, but tens of thousands of unmanaged (and often hostile) devices in the local network which we want to protect from each other and protect the outside world from. This unique arrangement very much drives home the value that an EDR brings to an XDR solution. Without good endpoint visibility, the challenge is far greater. The benefit of an open XDR approach that is not an evolution of an existing EDR offering is that it can be one of several EDRs, but “one” is preferable to none.
Malware Analytics
By: Ben Greenbaum
Cisco Malware Analytics (formerly Threat Grid) was again used as the backend file analysis and malware detection engine. We supported our partners from CoreLight and Netwitness, with analysis of files pulled from clear text (conference attendee) and select encrypted sessions (critical infrastructure).
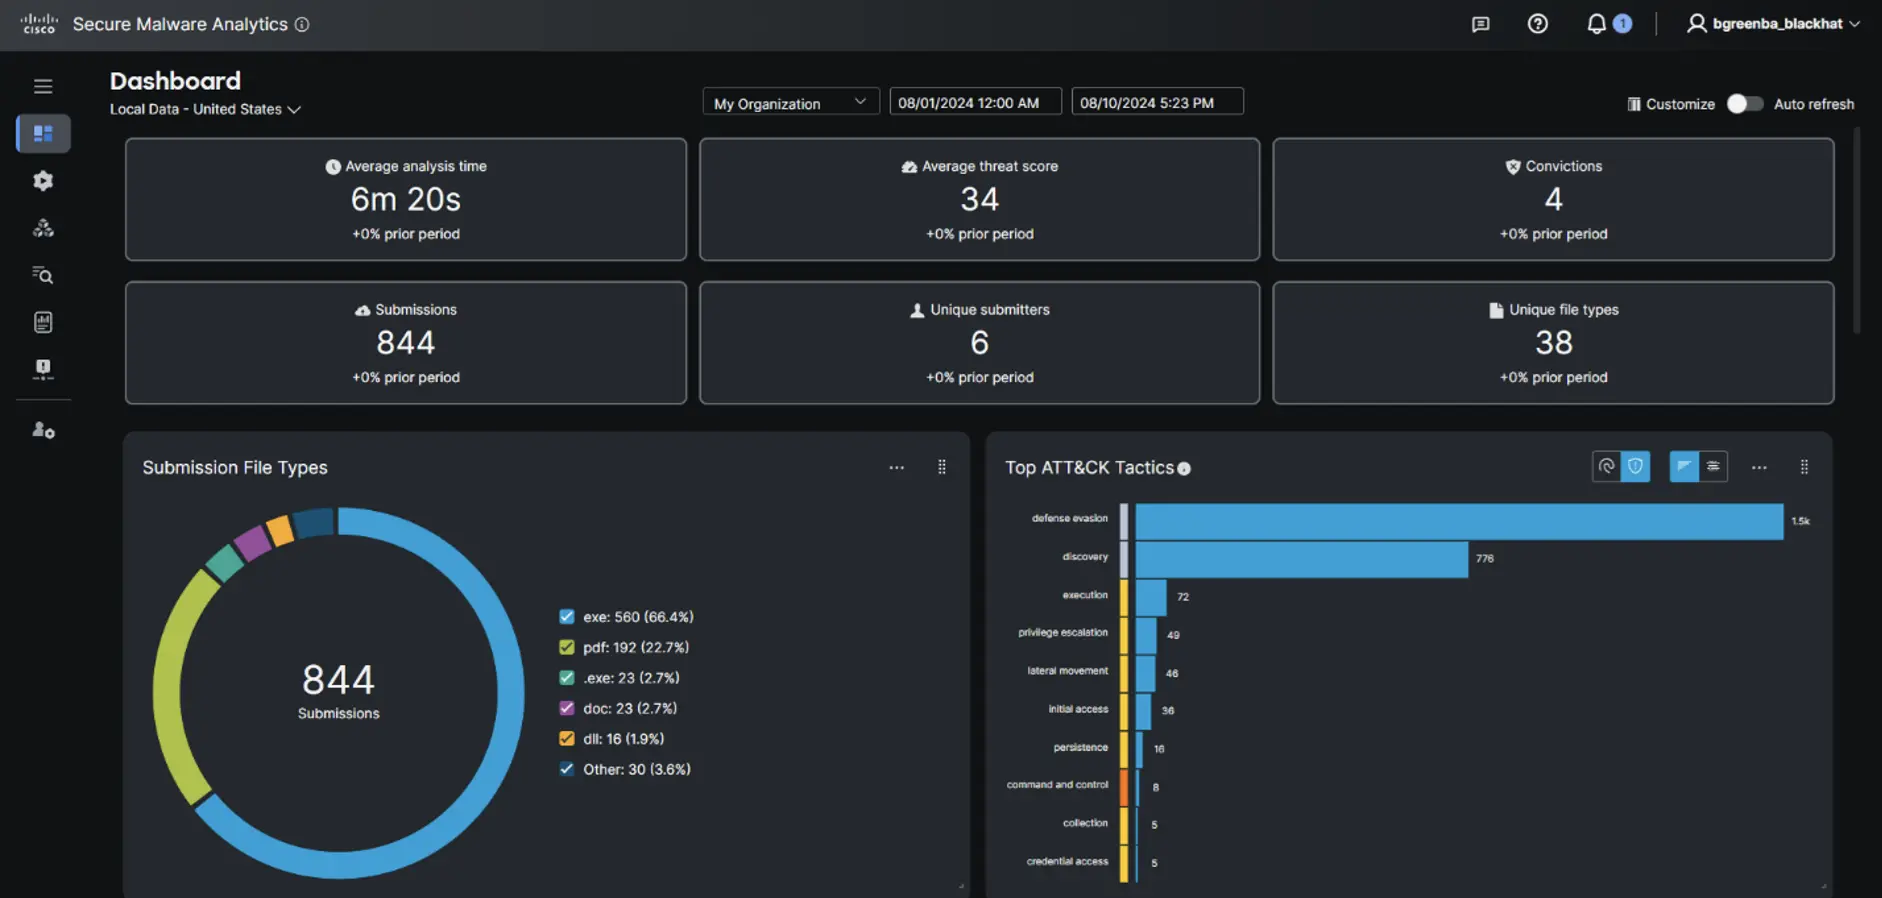
As usual, the files found in clear text communications were a good indicator of what kinds of information can be expected to be leaked by a crowd of security professionals, and this year the outcome rated a solid “less awful.” Potentially spicy content included various PII (names, employers, positions, email addresses, etc.) from Black Hat receipts and a few corporate email attachments.
And while Umbrella did alert us to some wandering infections phoning home, we can say that at least no malware was transferred…in the clear.
By: Aditya Sankar
Cisco XDR includes a built-in automation capability called XDR automation. If you have heard of Security Orchestration Automation Response (SOAR), Cisco XDR has the full suite of SOAR features. That includes the ability to drag-and-drop prebuilt code blocks in a particular sequence to create a custom workflow, executing arbitrary API calls to serve as one-click response actions and creating rules to trigger workflows based off a schedule or some other criteria.
We have been using XDR Automate at Black Hat for three years to improve the Cisco services to our joint customer, Black Hat, and have implemented a variety of use cases. However, this has typically required quite a bit of time to learn APIs and create a completely custom workflow. With the latest XDR Automation Exchange, the Exchange page is used to find, view, install and uninstall pre-written workflows that have been released or approved by Cisco engineers and content providers. Workflows authored by the community have passed a basic quality check and are supported by the Cisco DevNet Community on a best-effort basis. The Exchanges helps enable collaboration between workflow creators and additionally reduces the time it takes for a user to experience value from XDR automation.
Shout out to Ivan Berlinson, who wrote a workflow to pull threat logs from the Palo Alto Networks API and create Incidents in Cisco XDR. Since Ivan was kind enough to publish the workflow to the Exchange, it was extremely easy to import the workflow and get it operational. Installing a workflow from the exchange is essentially like walking through a configuration wizard. It includes a description of what the workflow does, the required targets and variables, as well as a contact person for support. Here is what the workflow looks like in the Exchange just before installation.
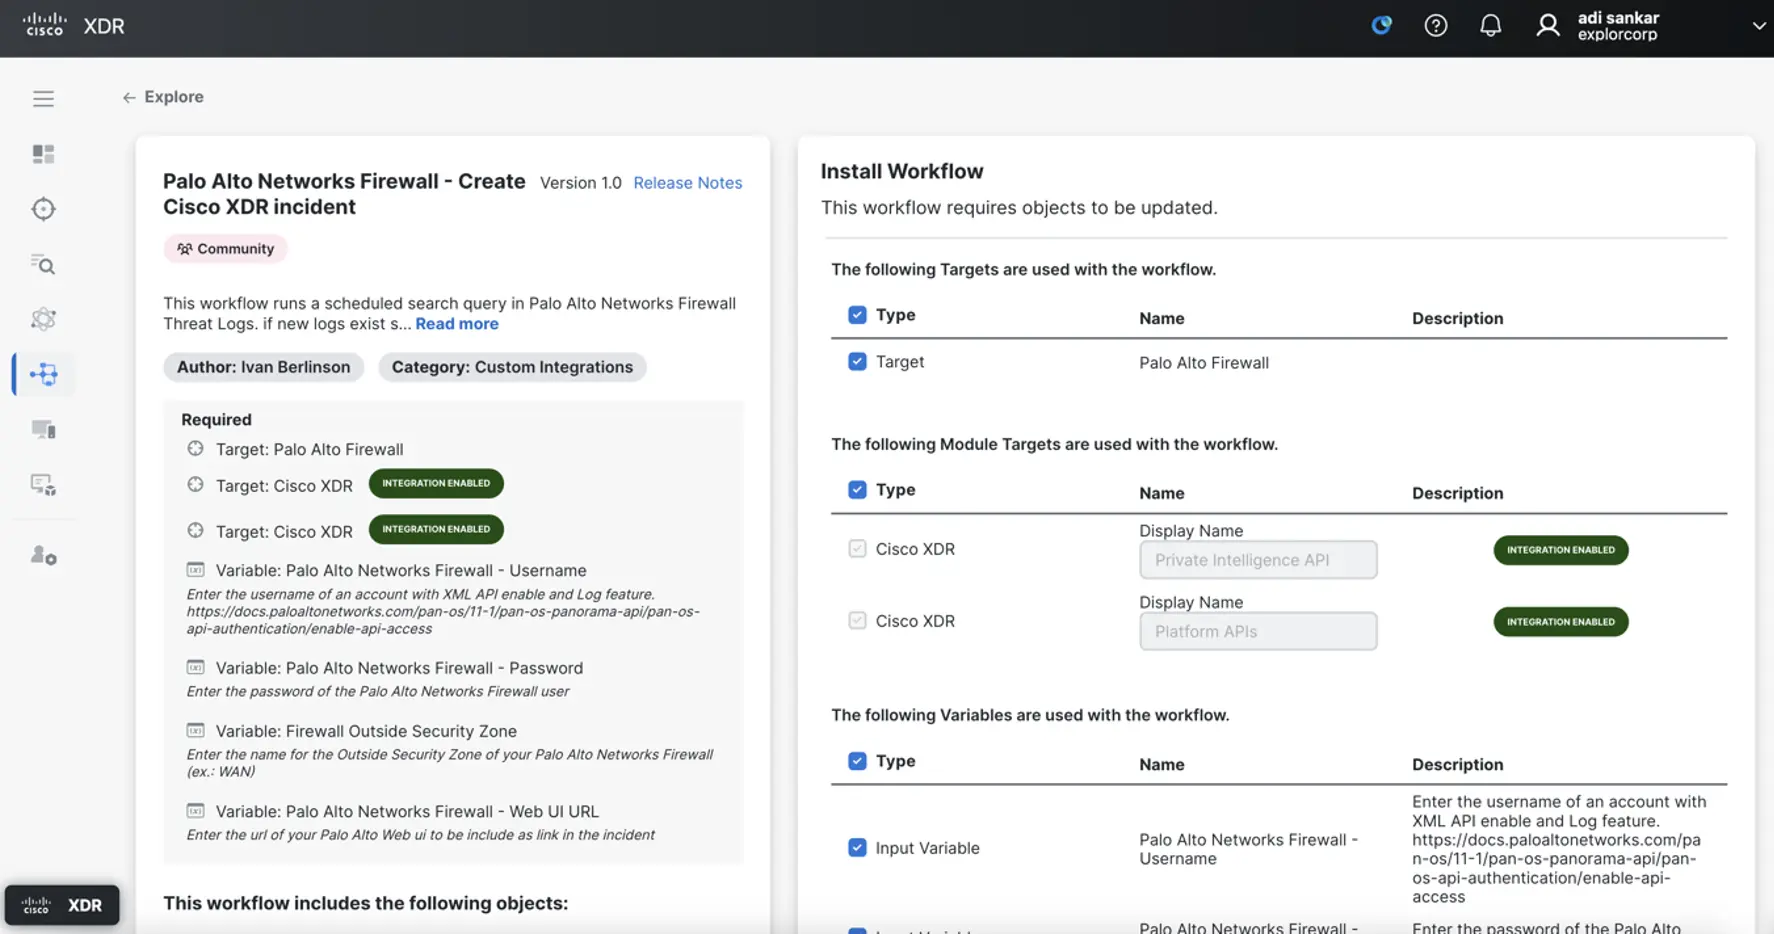
This workflow requires Automation remote, on-premises virtual machine deployed over ESXi to ensure proper connectivity to the Palo Alto Panorama appliance. Shoutout to Matt Vander Horst who helped with the vCenter required to deploy the Automation remote appliance. The Exchange prompts the user to provide values for the required variables and select the appropriate on-premises target.
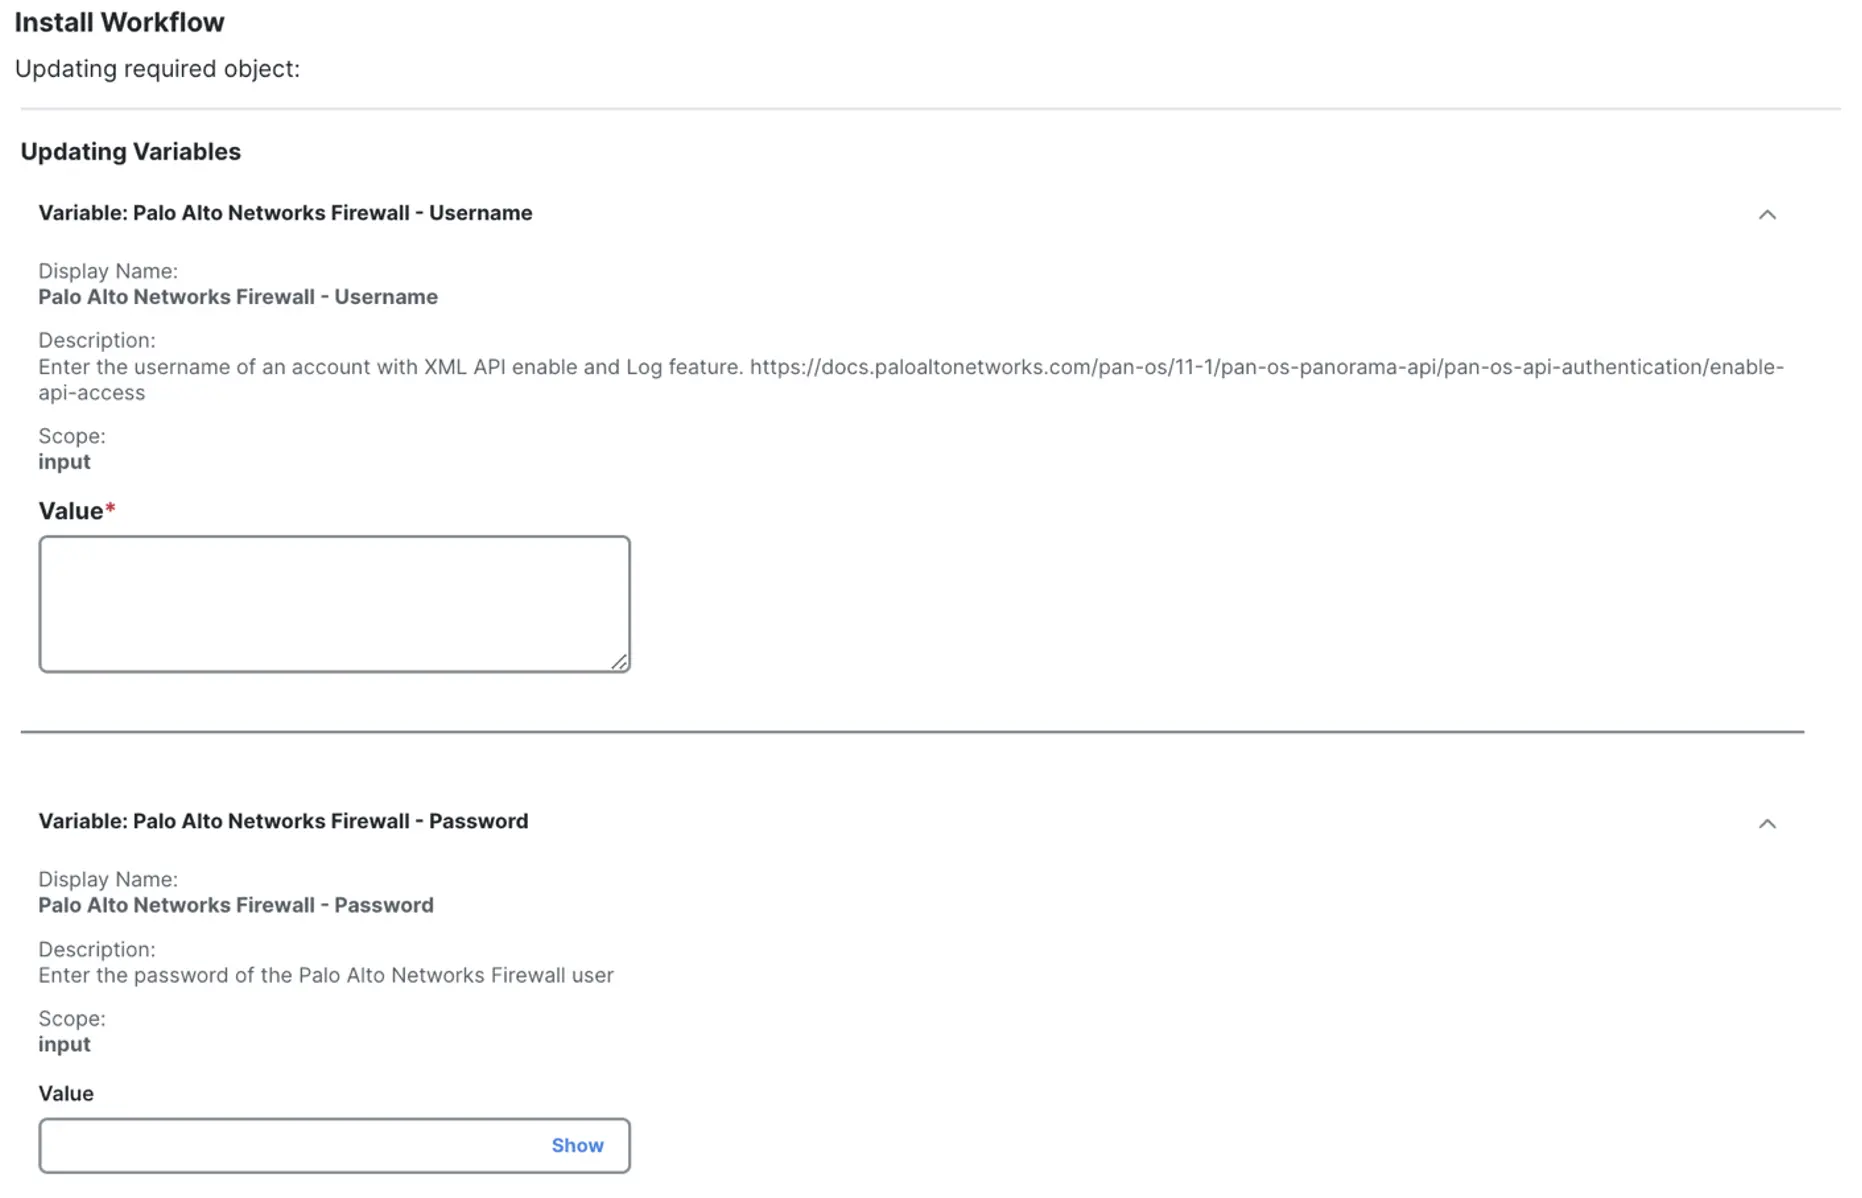
Then the workflow is installed and scheduled to run every 15 minutes via an automation rule.
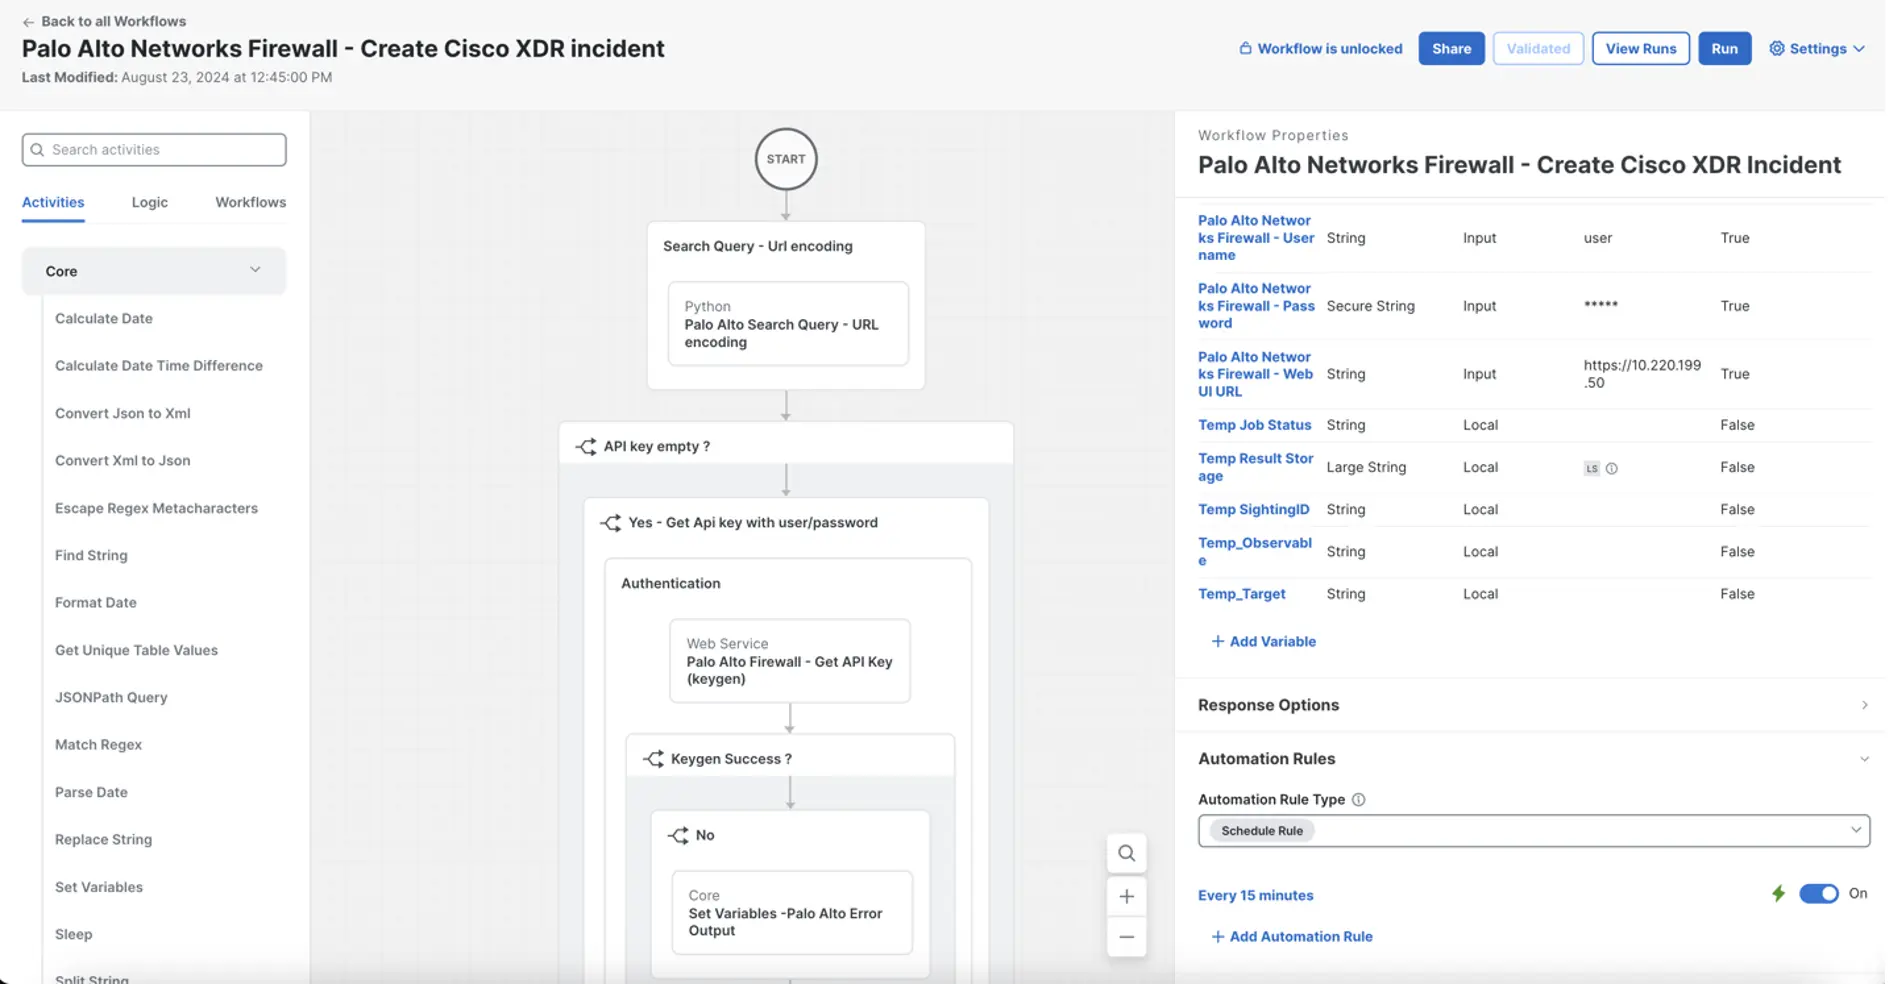
This workflow uses the PAN-OS XML API to query for threat logs at this path <?type=log&log-type=threat&nlogs=50>. This kicks off a search job. Once the search job is done, the workflow retrieves the results and starts parsing the threat logs. A Cisco Threat Intelligence Model (CTIM) sighting is created for each individual threat log and grouped together by internal host IP. Next, a CTIM indicator with the description of the threat log and a relationship to the corresponding sighting are both created. Finally, an incident bundle is created with the sighting, relationship and indicator entities and posted to the XDR API. The workflow has logic built in to check for duplicate incidents and existing indicators.

Here is what one of the incidents that was created from this automation workflow looks like in Cisco XDR. This gave us as analysts in the SOC a great starting point for an investigation.
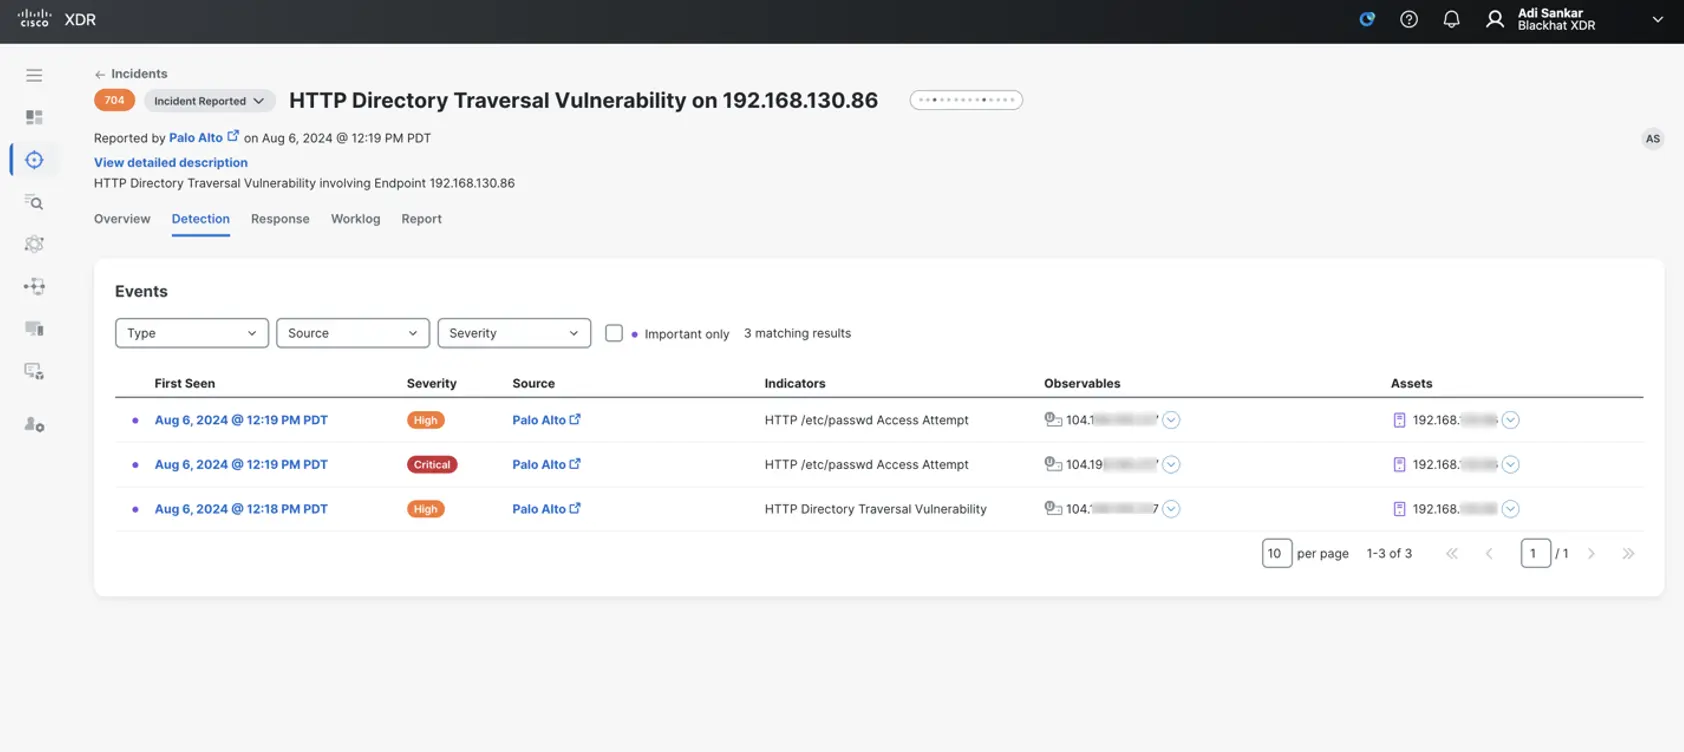
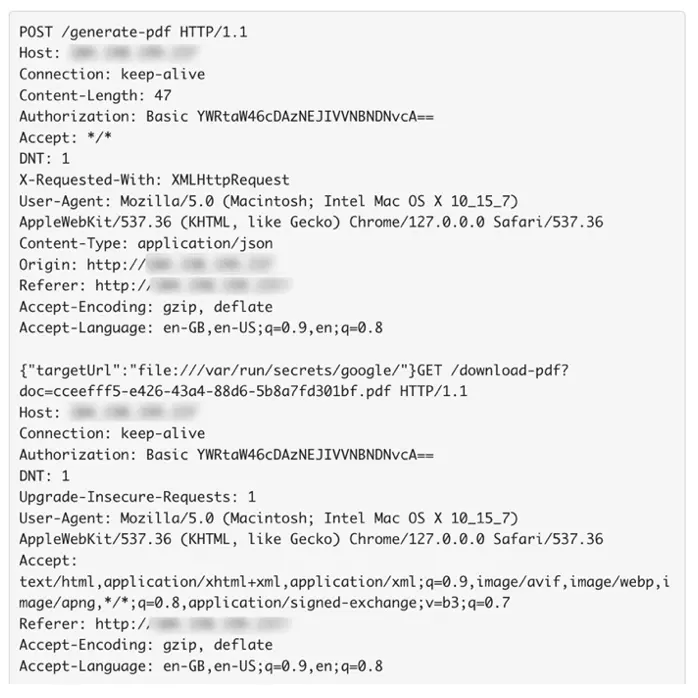
These Palo Alto Network threat logs indicate a directory traversal attack that aims to access files and directories that are stored outside the web root folder. PAN Firewall alerts on directory traversal and accessing </etc/passwd> from source IP 192.168.130.86 on general attendee Wi-Fi to destination IP <104[.]198.XXX.2XX>, which resolves to < yXXXXis[.]party>. This domain is marked as suspicious by multiple threat intelligence sources and has a medium risk score of 72 in Cisco Umbrella. The host then proceeded to download files from <file://var/run/secrets/> host with basic authentication in the HTTP POST header. This activity was then correlated to similar classroom activity, but the host MAC address was not seen in any classrooms.
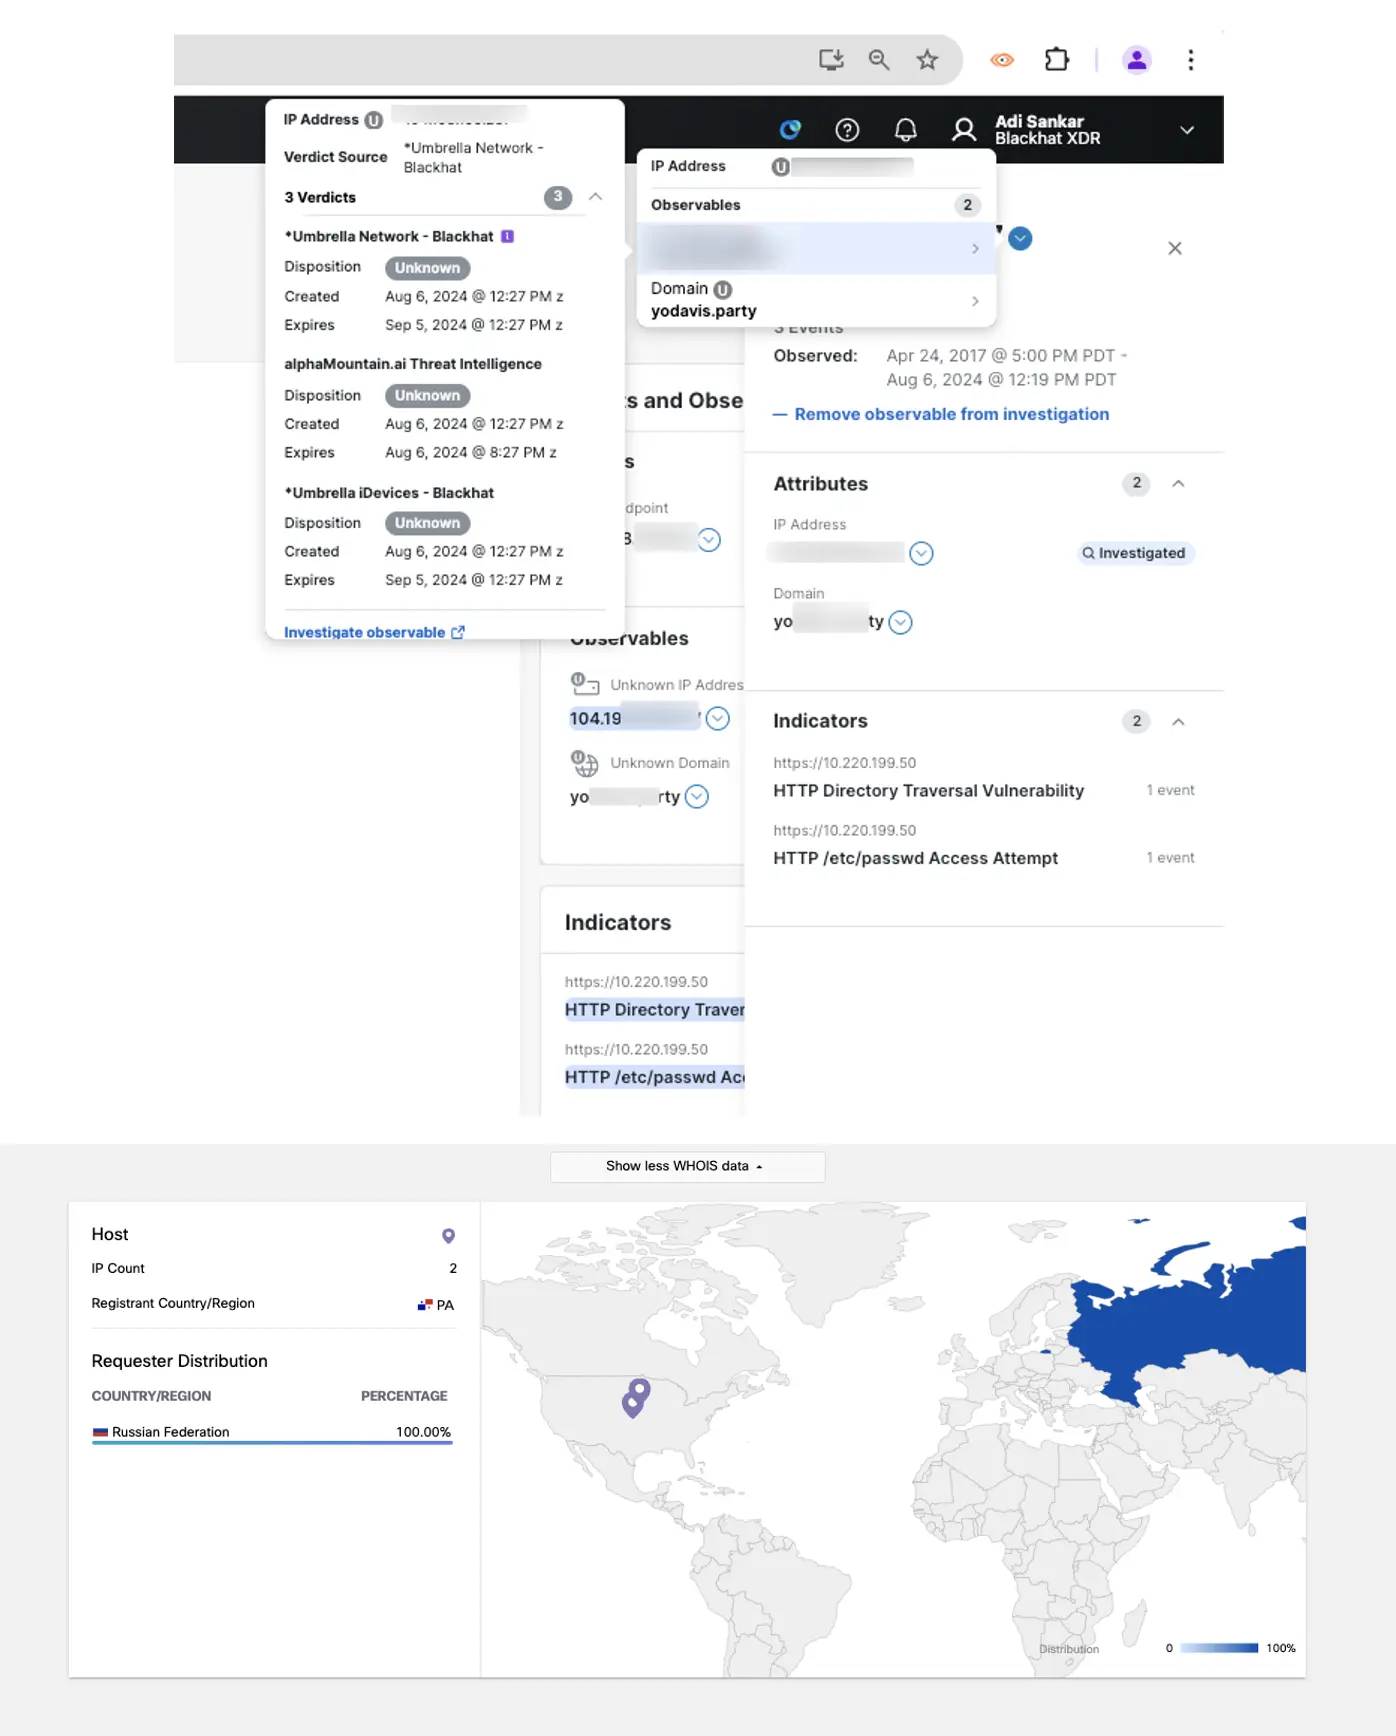
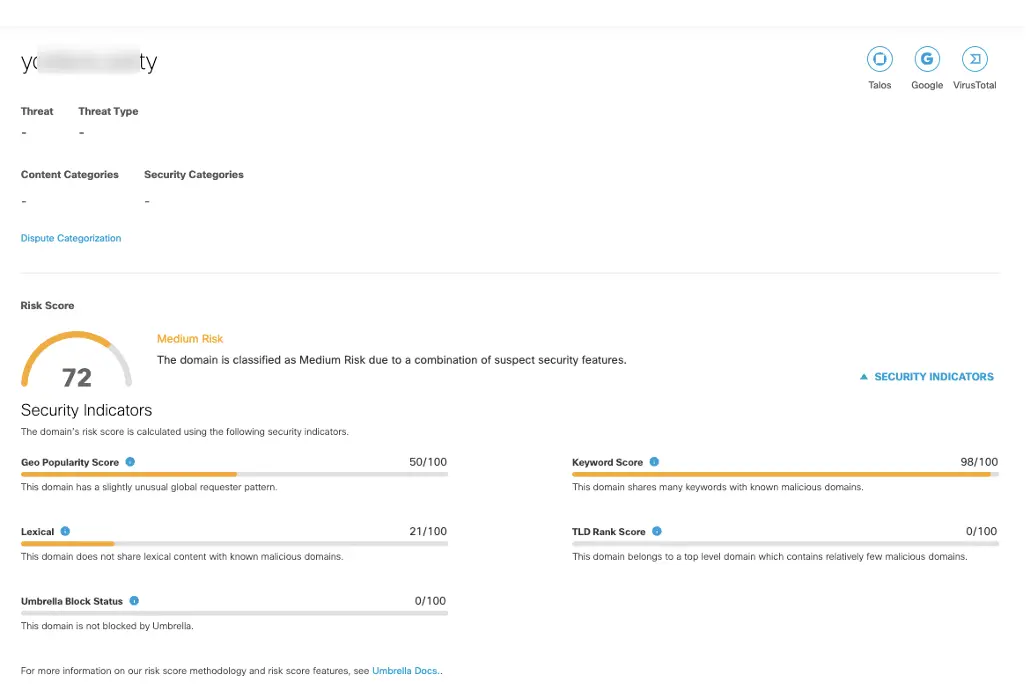
The destination IP shows unknown with XDR threat intelligence, but the domain it resolves to seems to be suspicious and it is hosted in the Russian Federation, as seen in the Umbrella console. Here are additional details provided by the Corelight team in our active Threat Hunting Slack chanel: HTTP POST activity to the destination in question shows a basic authentication token that decodes to <admin:p034BHUSA43op> which does look like it is being used for Black Hat training since it says BHUSA in the password. However, this source host’s MAC address was not seen in any classrooms, only on the general Wi-Fi.
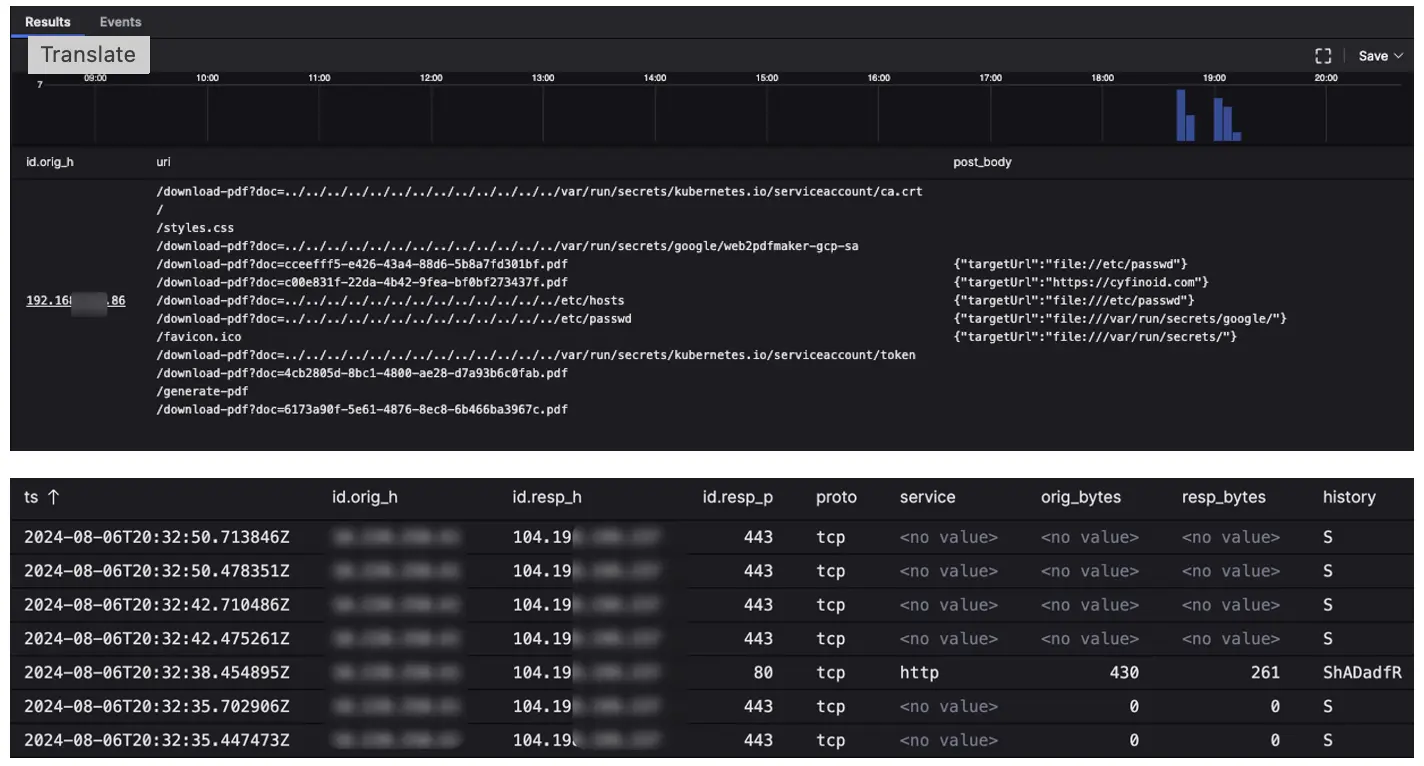
We did notice the host making similar queries like <uri = /token$/ uri=/kubernetes/>, which were seen in the Advanced Infrastructure Hacking class, but it is not enough to attribute this activity to a class. Anyhow, this behavior typically should not be seen on the general Wi-Fi. In this scenario, we did not take any action of blocking the destination IP or forcing a captive portal for host IP since the Black Hat network aims to monitor for attack and abuse, but not block malicious traffic.
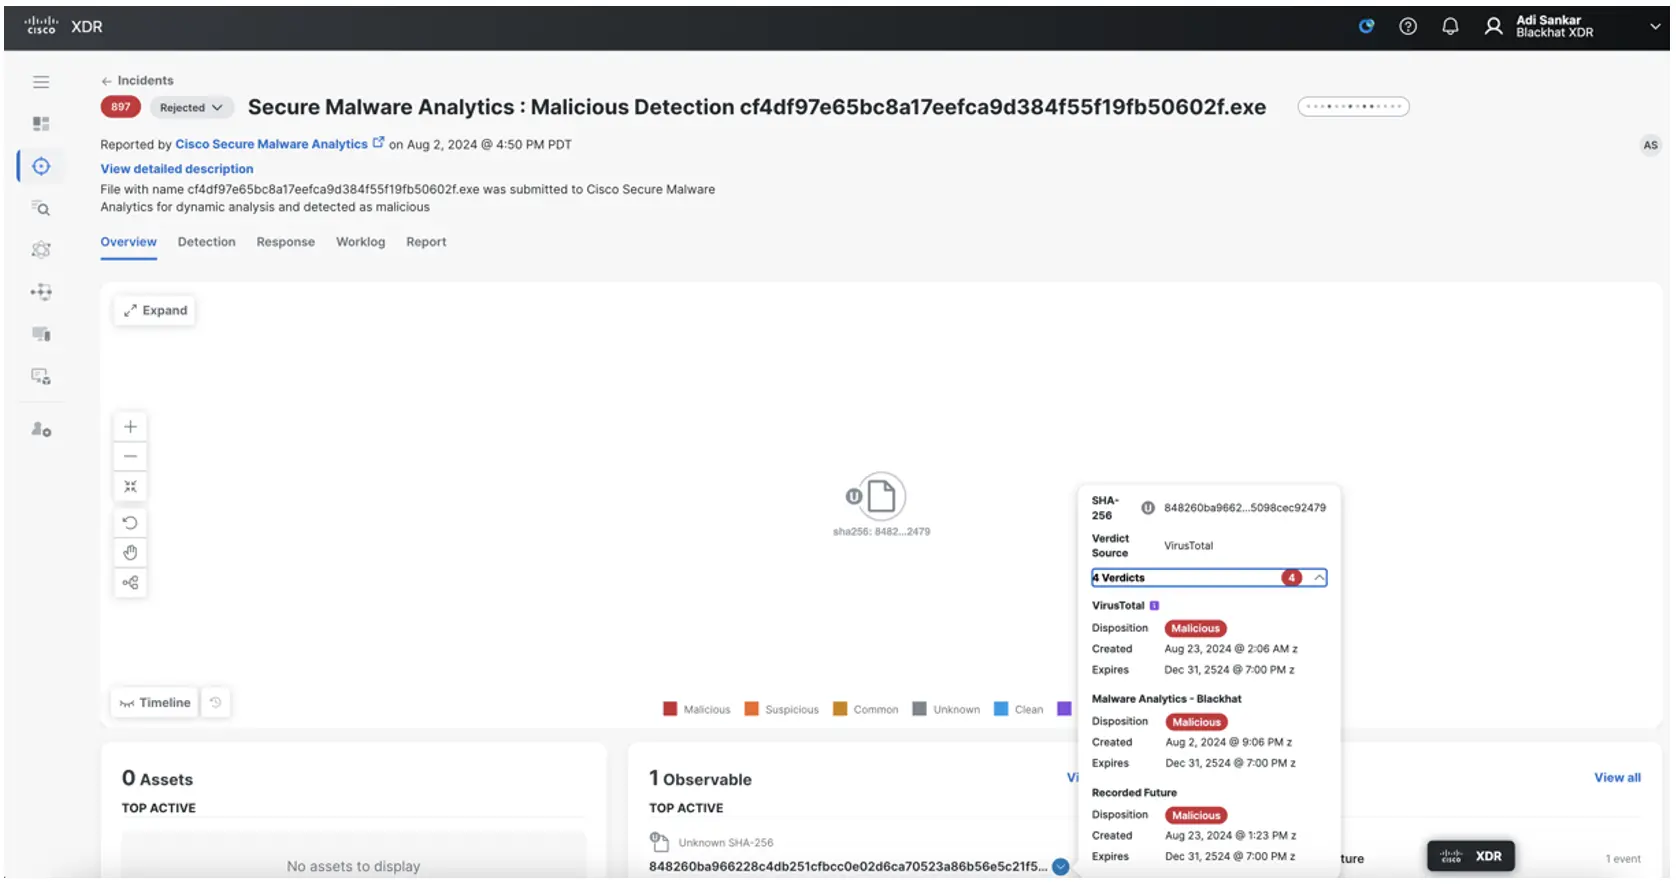
Ivan Berlison also provided another workflow to produce an XDR Incident when a file is convicted in Cisco Secure Malware analytics. Corelight, as well as NetWitness, carve files off the network and submit them to be detonated in Secure Malware Analytics. Here is what the XDR incident looks like when a file with a threat score above 90 is seen:
We had a wonderful time innovating and investigating at Black Hat USA 2024! The XDR automation exchange was a huge aid in adding more automation capabilities with very minimal custom work. Check out AJ Shipley’s blog on how using Cisco XDR at Black Hat has accelerated our open ecosystem. We’ll be back again next year, so long Black Hat!
Splunk Attack Analyzer (SAA)
By: Ryan MacLennan
Splunk Attack Analyzer (SAA) is a new addition to our deployment. As you may know, Cisco acquired Splunk this year. Because of this new acquisition we worked with our counterparts in Splunk to get their SAA product provisioned for our use at Black Hat. SAA is a file and URL analysis platform similar to Secure Malware Analytics. SAA uses a sophisticated set of criteria to determine which engine would be best suited for analysis — like web analyzer, static file analysis, email analyzer, signature engines and/or the sandbox. While the product is capable of dynamic and static analysis, we chose to do only static analysis for our use at Black Hat.
What is truly powerful about the analysis of SAA is its attack chain following capability: The ability to intelligently determine how a human would click on items in a webpage. It will follow links, download files and analyze additional indicators from network connections, known malicious files, an unknown malicious file that is analyzed on the fly, phishing domains and more. It will follow a logical flow like a human to determine the path to compromise. This was interesting to see in our environment as it showed the path from a file, the links found in it, to different websites, and each step of the path had a screenshot for us to follow along.
As an example, we have a PDF that was submitted to SAA. It found links in the file and followed them to see if they would lead to something malicious. I have blocked out most of the URLs, but we can see how it went through the PDF data and clicked on the links to find out where it would go.
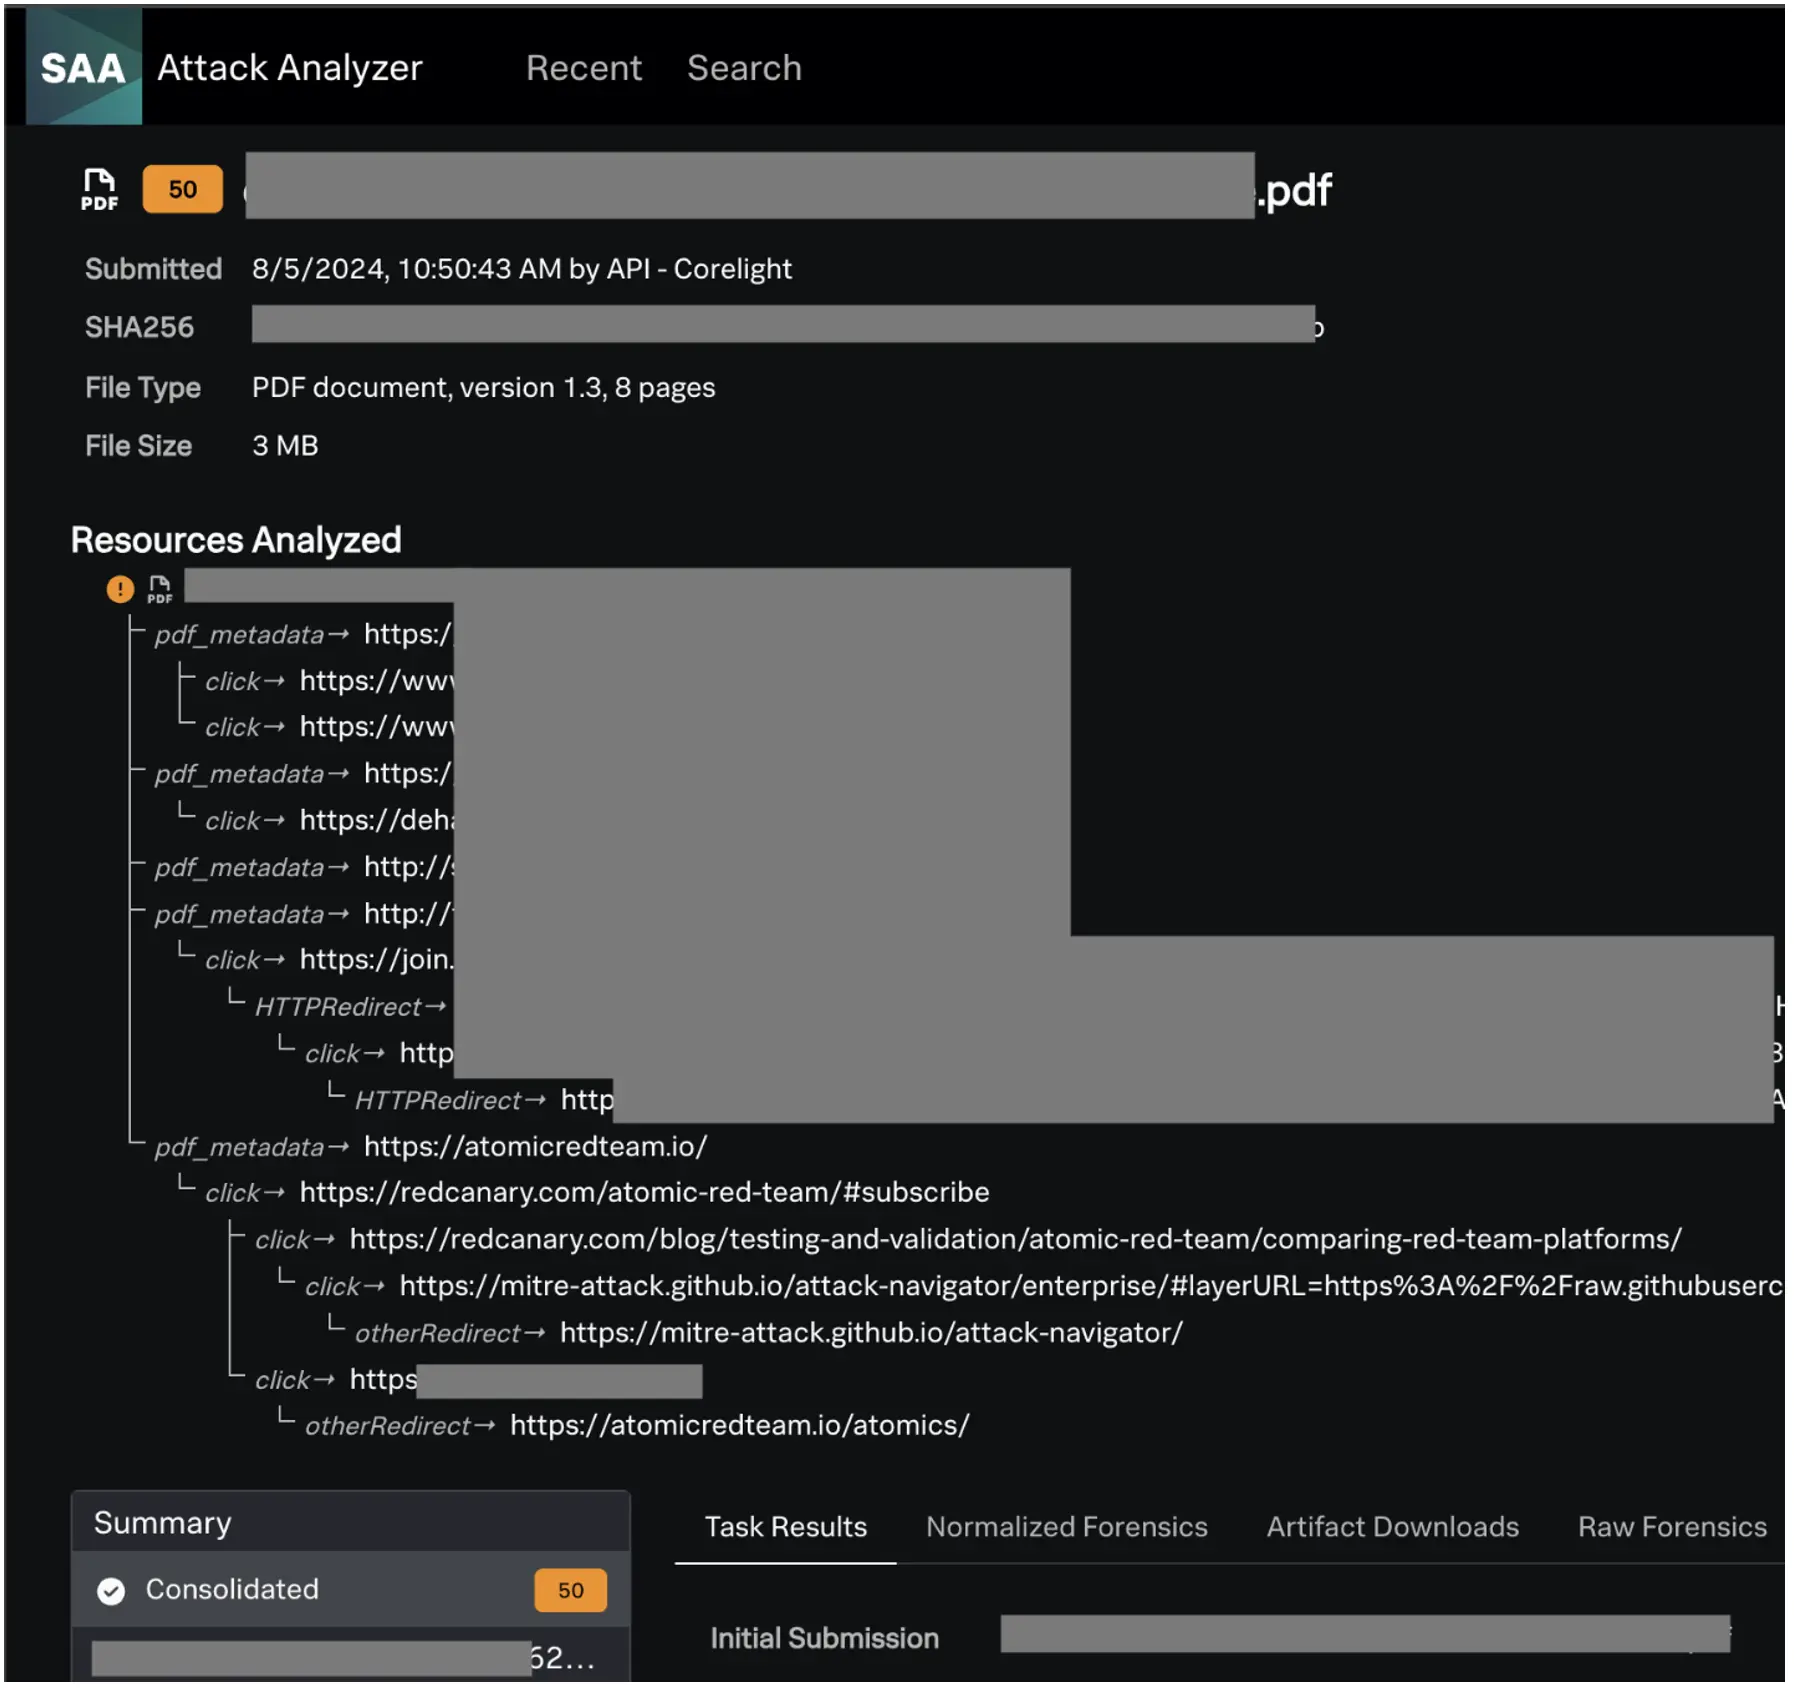
After SAA did its thing, we could look at the file in question and the screenshots that it took. We found that this file was the guide used in a training room and each link was a reference to an article, a training resource (self-hosted and official), or other informational resources a student may need.
We were able to add this integration with the help of our partner Corelight. We talked to them on day one and they were excited to get a new integration developed with SAA. A few hours later, we had an integration with them. This was an amazing example of how we all come together to make the NOC better at Black Hat every year.
Umbrella DNS
By: Christian Clasen and Justin Murphy
If you have read the previous Black Hat NOC/SOC reports, you know that in 2023, we made a change to the DNS design. In prior conferences, we assigned internal forwarders to clients via DHCP, but did not force their use. Essentially, attendees could use any DNS resolvers they chose, and we didn’t interfere. The change we implemented was to begin forcibly redirecting DNS traffic to the on-premises DNS forwarders. You can see in the statistics above that this change caused a significant jump in queries processed by Cisco Umbrella — from 54.4 million to 79.3 million.
The steep increase in query count was not unexpected. What was unexpected, however, was a decrease in query count between 2023 and 2024. While we don’t know the precise cause of this drop, we do have some theories and ways we can test them going forward.
One possible explanation is the prevalence of encrypted DNS protocols. In recent years, the industry has turned its attention to the privacy, integrity and authenticity problems inherent in the plain-text DNS protocol. To solve some of these issues, “last-mile” encryption has become a favorite of OS and browser vendors. DNS-over-HTTPS (DoH) and DNS-over-TLS (DoT) are only a couple of the most popular ways to encrypt DNS between the client and the recursive resolver.
Detecting all encrypted DNS can be difficult and counting the queries impossible. This is because TCP is the chosen transport for DoH and DoT, and this allows the client to pipeline multiple queries over one long-lived TCP and TLS session. But what we can often find are the “bootstrap” plain-text DNS queries that enable to client to find the encrypted DNS server. By running a report in Umbrella for the category “DoH and DoT”, we can get a handle on the most popular of these services:
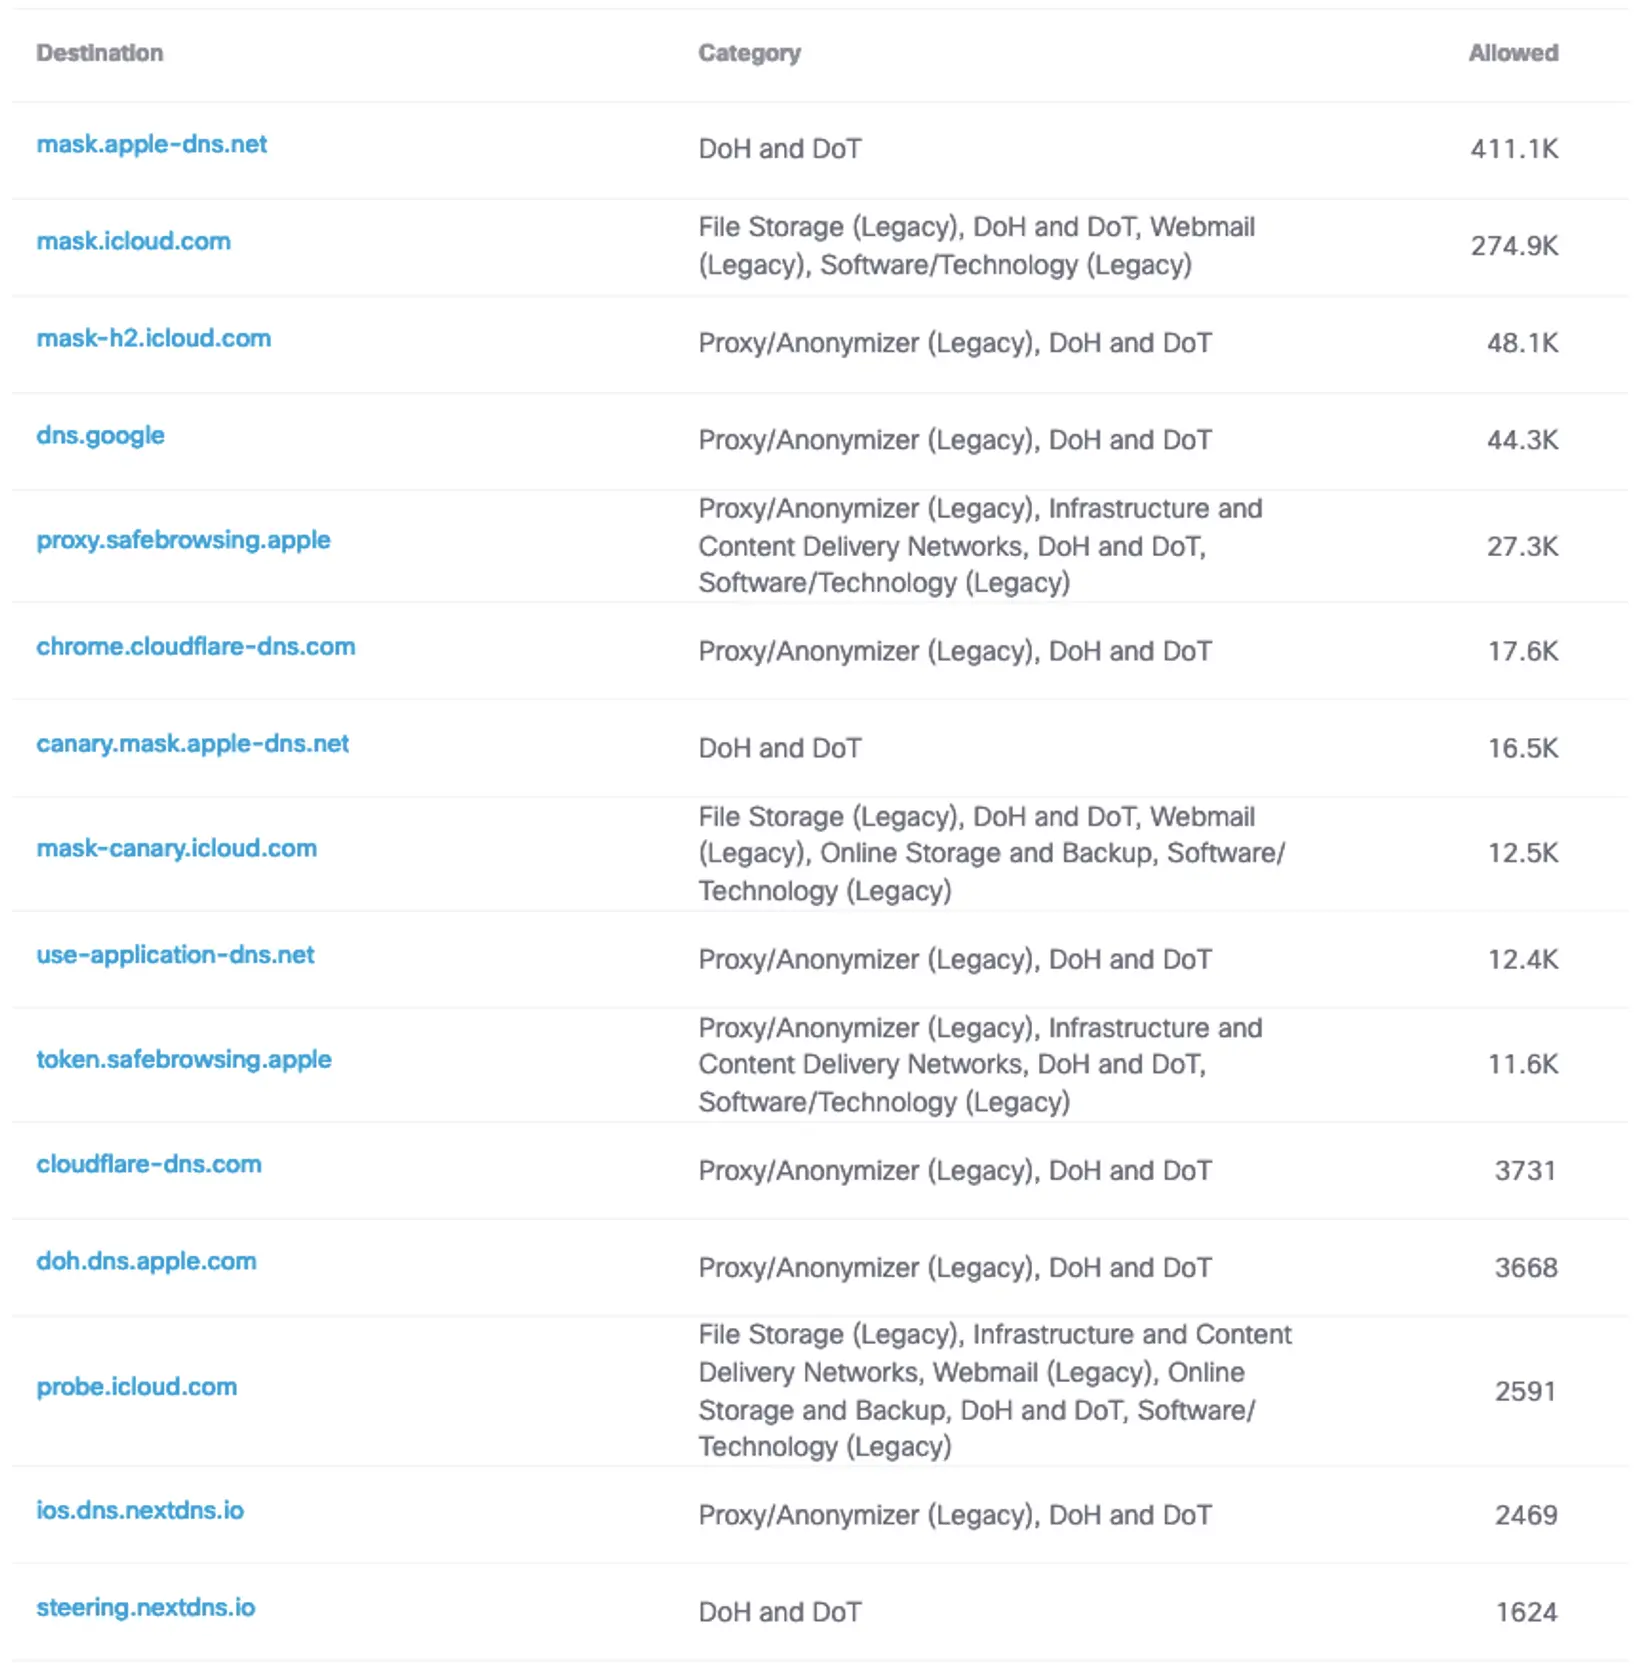
The entry for <dns.google> is most likely indicative of Android mobile devices who use this DoT resolver by default. The count of queries for that particular service is likely to be higher because the sessions on those devices are known to be short-lived if queries are not frequent enough.
In this report, we also see “canary” domains such as <canary.mask.icloud.com> and <use-application-dns.net>. The latter domain is used by Firefox to detect when it should fall back to unencrypted DNS on the network. More details on how Umbrella interacts with these is written up in the Umbrella support article for web browsers and DoH default.
Going forward, we will track the statistics of these protocols on the conference networks and see what other information we can gather using the full packet capture capabilities of our partners and the threat hunting capabilities of Cisco XDR. You can expect this topic to be expanded on in the next conference report.
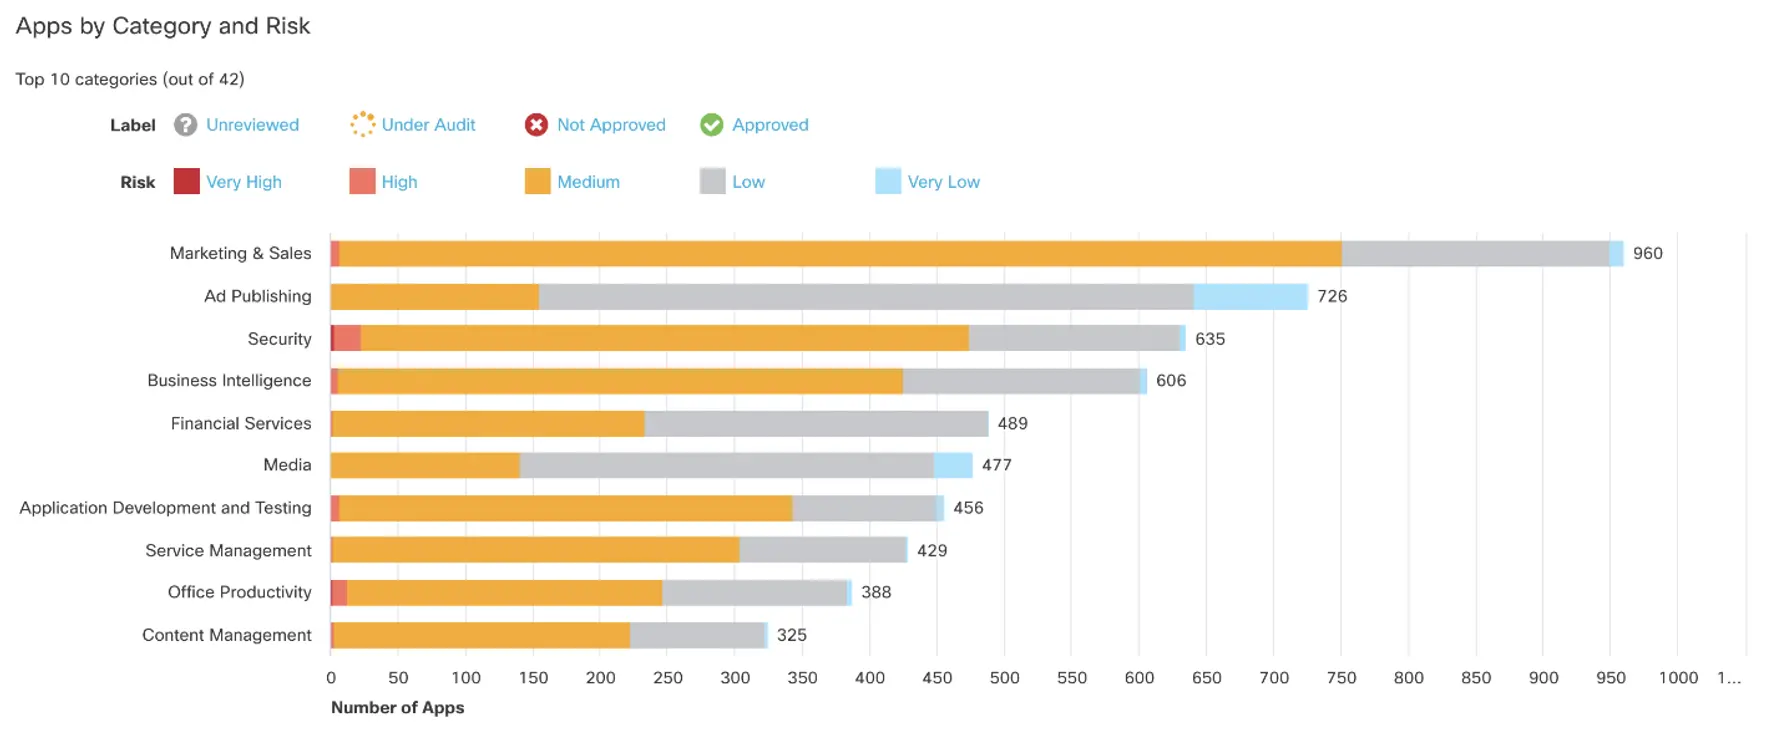
One of the primary reasons to at least monitor DNS is to understand trends and how the network at Black Hat is being used from a high level. There are many insights that can be gained from forcing DNS through a centralized service with intelligence. DNS queries exist for destinations that host everything from Malware, Crypto Mining and Phishing to content categories like Social Media, Finance and Illegal Activities. Furthermore, those domains can be categorized into specific applications as well. With the App Discovery report in Umbrella, these domains are grouped by application, identifying the potential use of thousands of applications. This could be web apps or other desktop/mobile apps.
As always, we continue to see a rise in app usage at Black Hat:
- BHUSA 2019: ~3,600
- BHUSA 2021: ~2,600
- BHUSA 2022: ~6,300
- BHUSA 2023: ~7,500
- BHUSA 2024: ~9,300
This year there was one stand out Application Category that has been growing in popularity: Generative AI. It will likely be no surprise that there are more attendees and their tools using Generative AI. We have gone from seeing it as a footnote in logs to reporting it at RSAC 2024, as we saw 80 different Generative AI tools being used.
Compare this to Black Hat 2024, just a few months later, where the total number has jumped to 194.
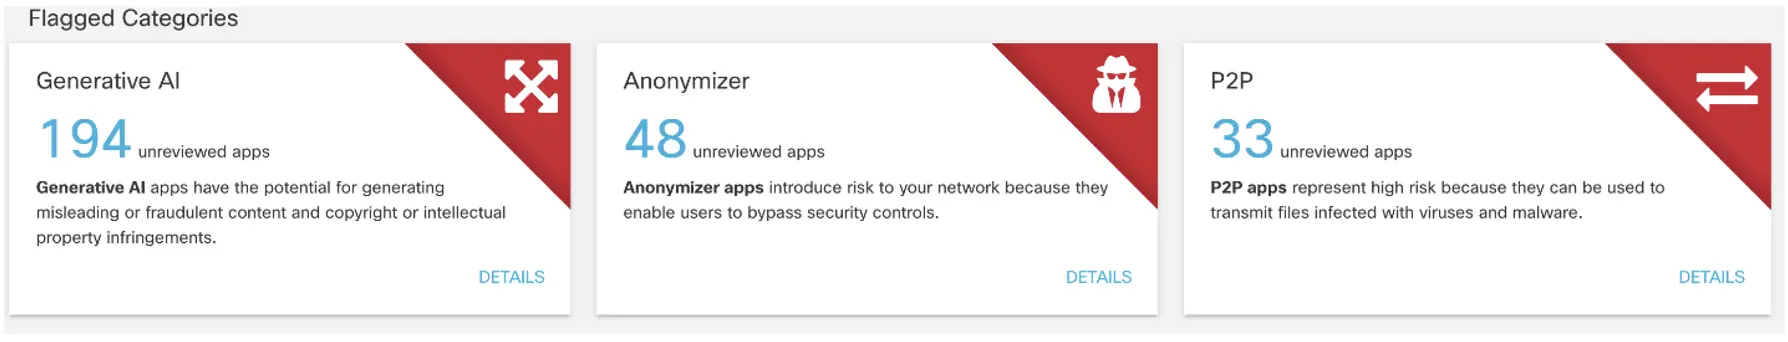
This does not appear to be just a difference in conferences, but rather a growing trend and acceptance of these tools.
Network Assurance
By: Adam Kilgore, Shimei Cridlig, Shannon Wellington and Justin Murphy
The ThousandEyes deployment launched at Black Hat USA 2023 one year ago. At that conference, we spent many long shifts developing the configurations, design, and procedures that formed the basis for our conference coverage. The deployment was further improved and streamlined at Black Hat London and Black Hat Asia. At this year’s Black Hat USA 2024, we were ready to expand our coverage significantly while continuing to refine our procedures.
New hardware
We added 20 Orange Pi devices at Black Hat 2024, in addition to the 8 Raspberry Pi devices we deployed in 2023. We’re still well short of the proverbial thousand eyes, but 28 is a lot more than 8. We deployed our new fleet of Orange Pi devices to monitor the wireless network, while the old Raspberry Pi devices were used for wired monitoring of Registration, the NOC and core network devices.
Orange Pi configuration
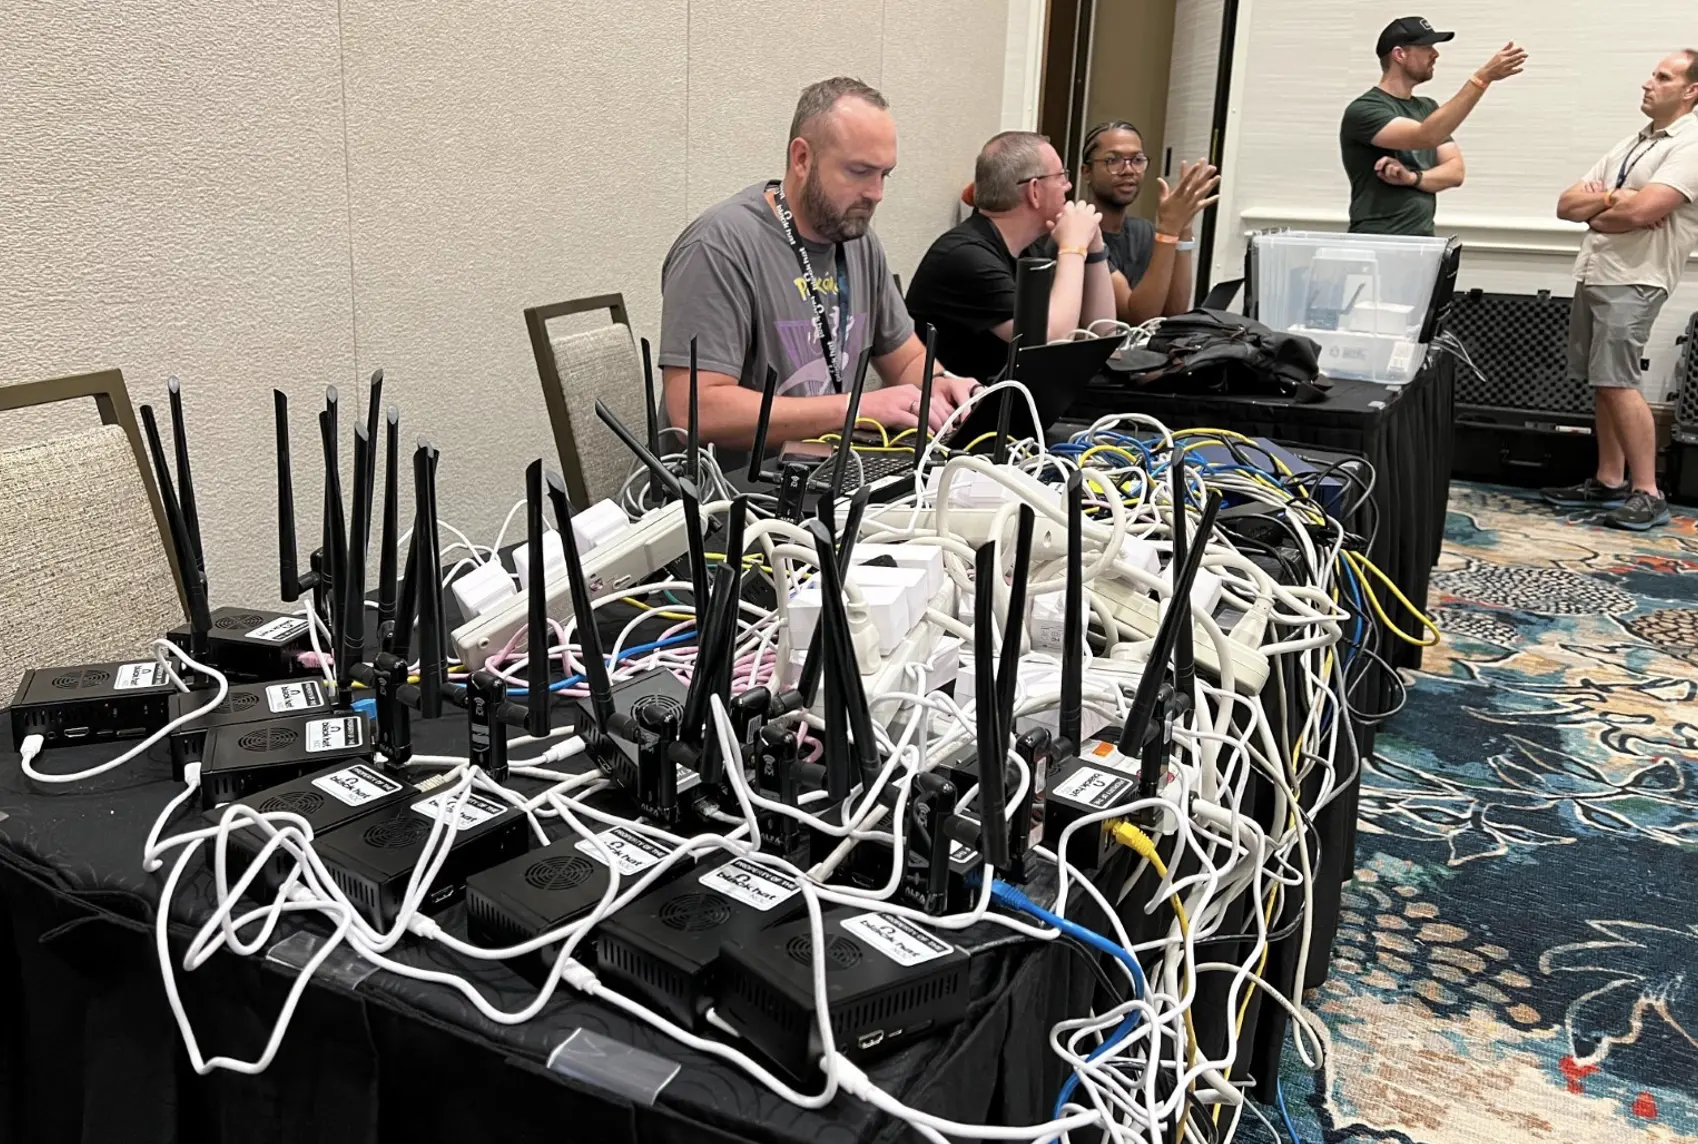
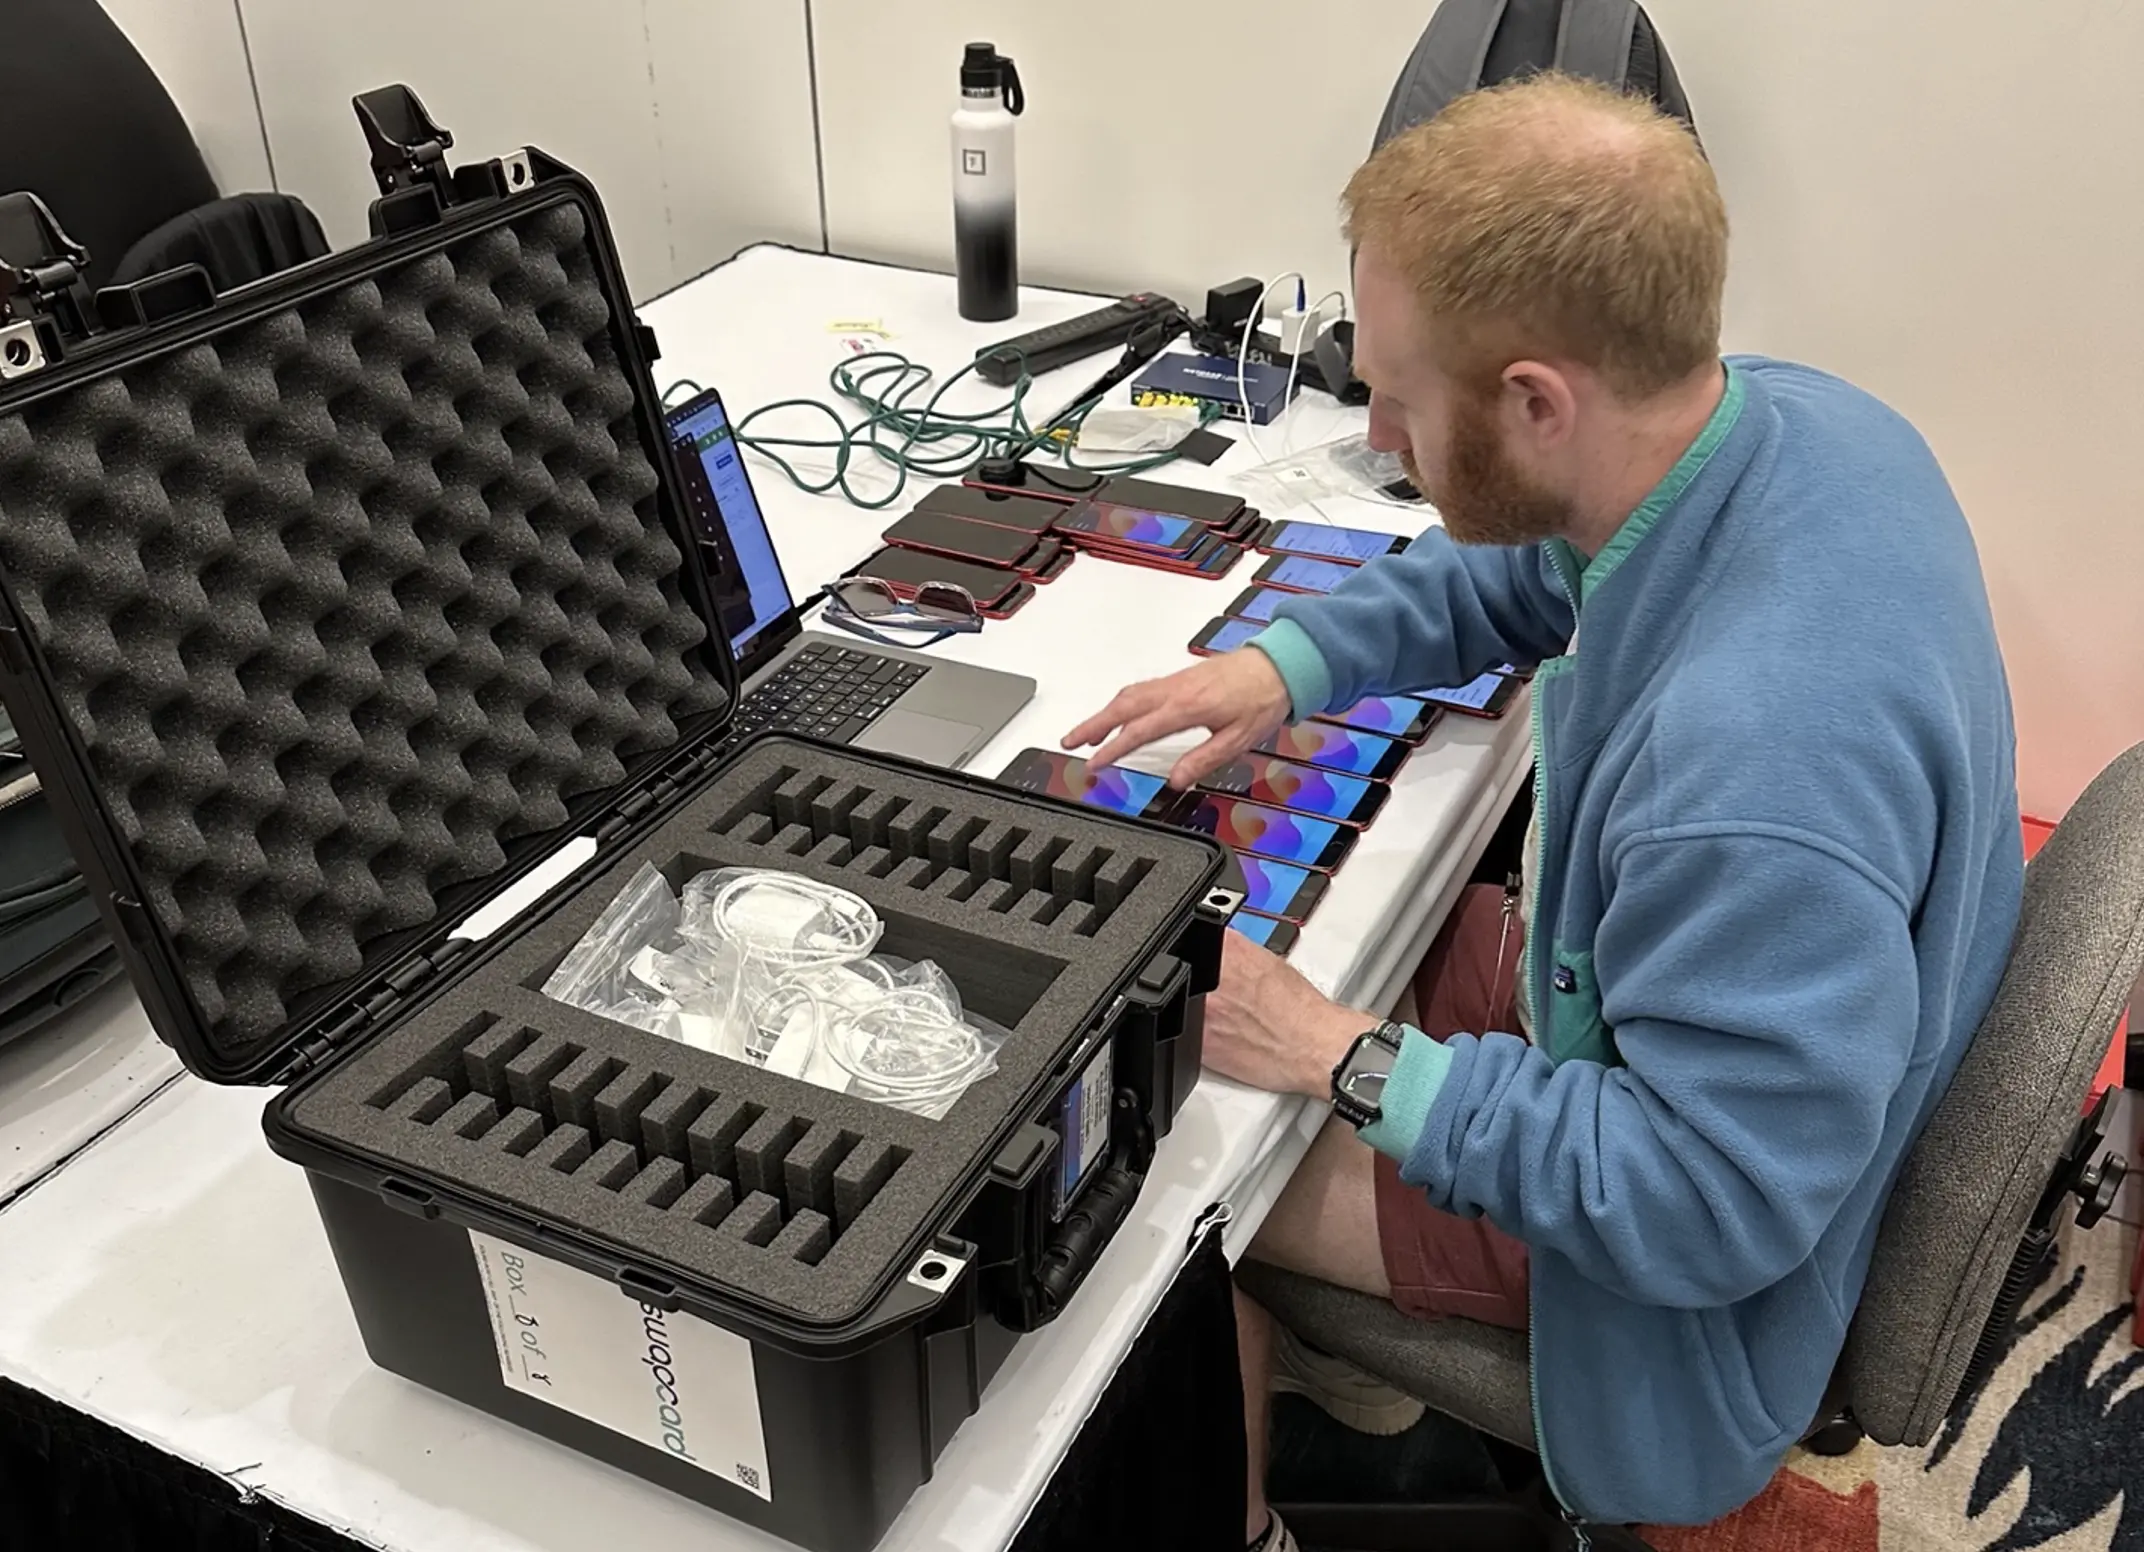
Mike Spicer put in a lot of time to develop new configuration and deployment procedures for the Orange Pi devices before the conference. We were able to use a script and a small local network to configure each Orange Pi with a specific SSID and PSK. Once the Pi devices were configured and the target access points were deployed, each Pi was walked to its target training room where it would automatically connect to the access point (AP) on bootup and begin running its scheduled monitoring tests.
Even with the scripting and automation, the configuration stage still resulted in a mass of wires (pictured above). Deploying the Pi devices resulted in more walking than the average attendee would experience in a conference (not pictured).
Expanded wireless coverage
With the additional agents, we were able to deploy to more Black Hat training rooms. The expanded visibility allowed us to catch more problems before the training rooms went live, including a misconfigured PSK, an SSID that wasn’t broadcasting and an SSID that broadcast but did not have internet connectivity. We’d love to have an agent for each training room for full visibility and validation heading into the conference, but we’re happy with what we caught and the additional confidence the agents provided heading into the training days.
As the conference shifted from trainings to the briefing days, we shifted our coverage from the largest training sessions to large briefing rooms and heavy-traffic areas like the entrance and Business Hall. While we still had to make tough strategic decisions about what to cover and what not to cover, we were still able to spread agents across each floor for general visibility.
Troubleshooting
Our experiences over the past three conferences had produced well-established troubleshooting procedures and documents for the Raspberry Pi devices, but the Orange Pi devicess presented fresh challenges. We had around 25% of our deployed Orange Pi devices require troubleshooting during the first 24 hours after deployment, a concerning rate. Log analysis revealed the wireless NIC becoming disconnected and the USB entering a disconnect loop (the wireless NIC is connected via USB on the Orange Pi devices). The problems with the wireless NIC and USB lead to a recurring ThousandEyes agent core files — a difficult set of problems.
However, these issues turned out to be isolated rather than widespread, and by the end of the conference we had a full wireless deployment that was staying up all day and overnight as well. For what turned out to be isolated wireless problems, we developed troubleshooting procedures and documentation.
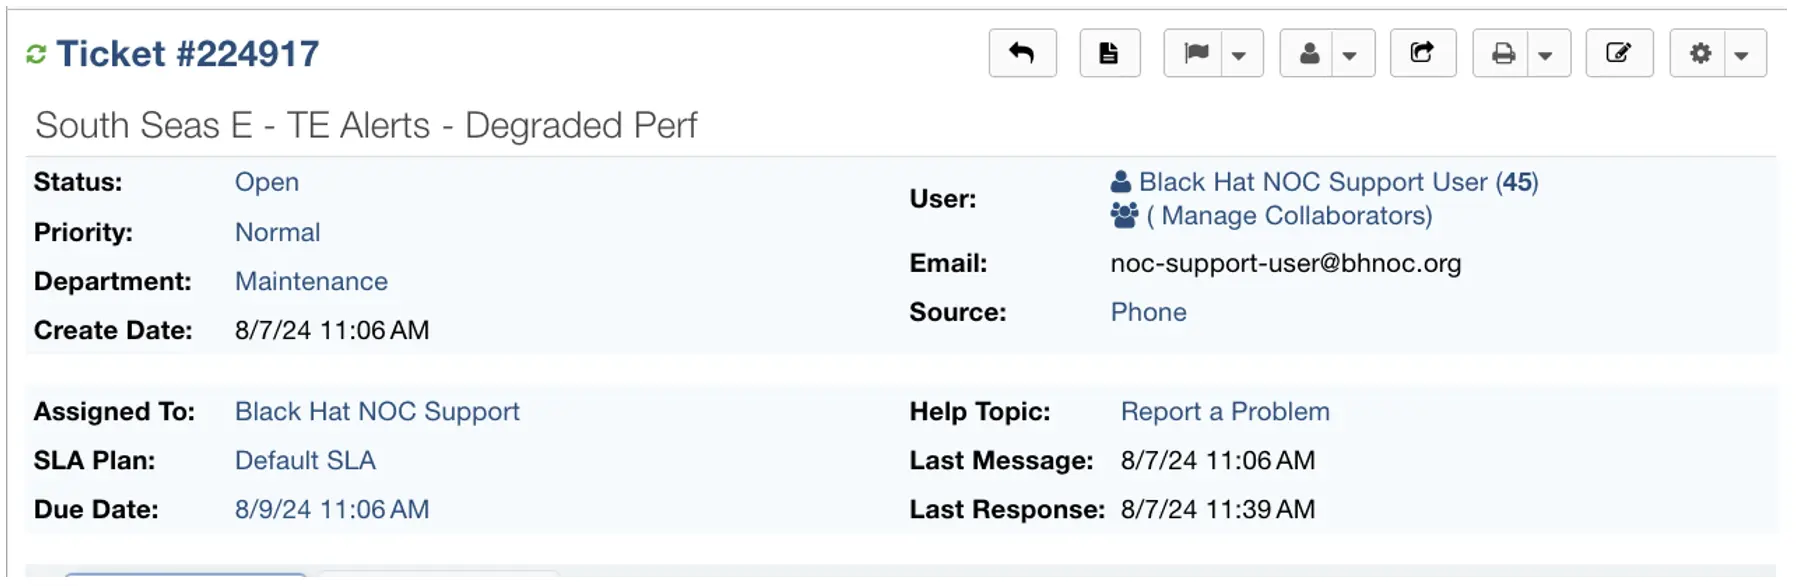
Automated ticketing
A new ticketing system was rolled out at this conference that would create tickets in Slack based on ThousandEyes data or reported issues. Below is a ticket created based on TE alerts for a specific conference room during the first morning of briefings.
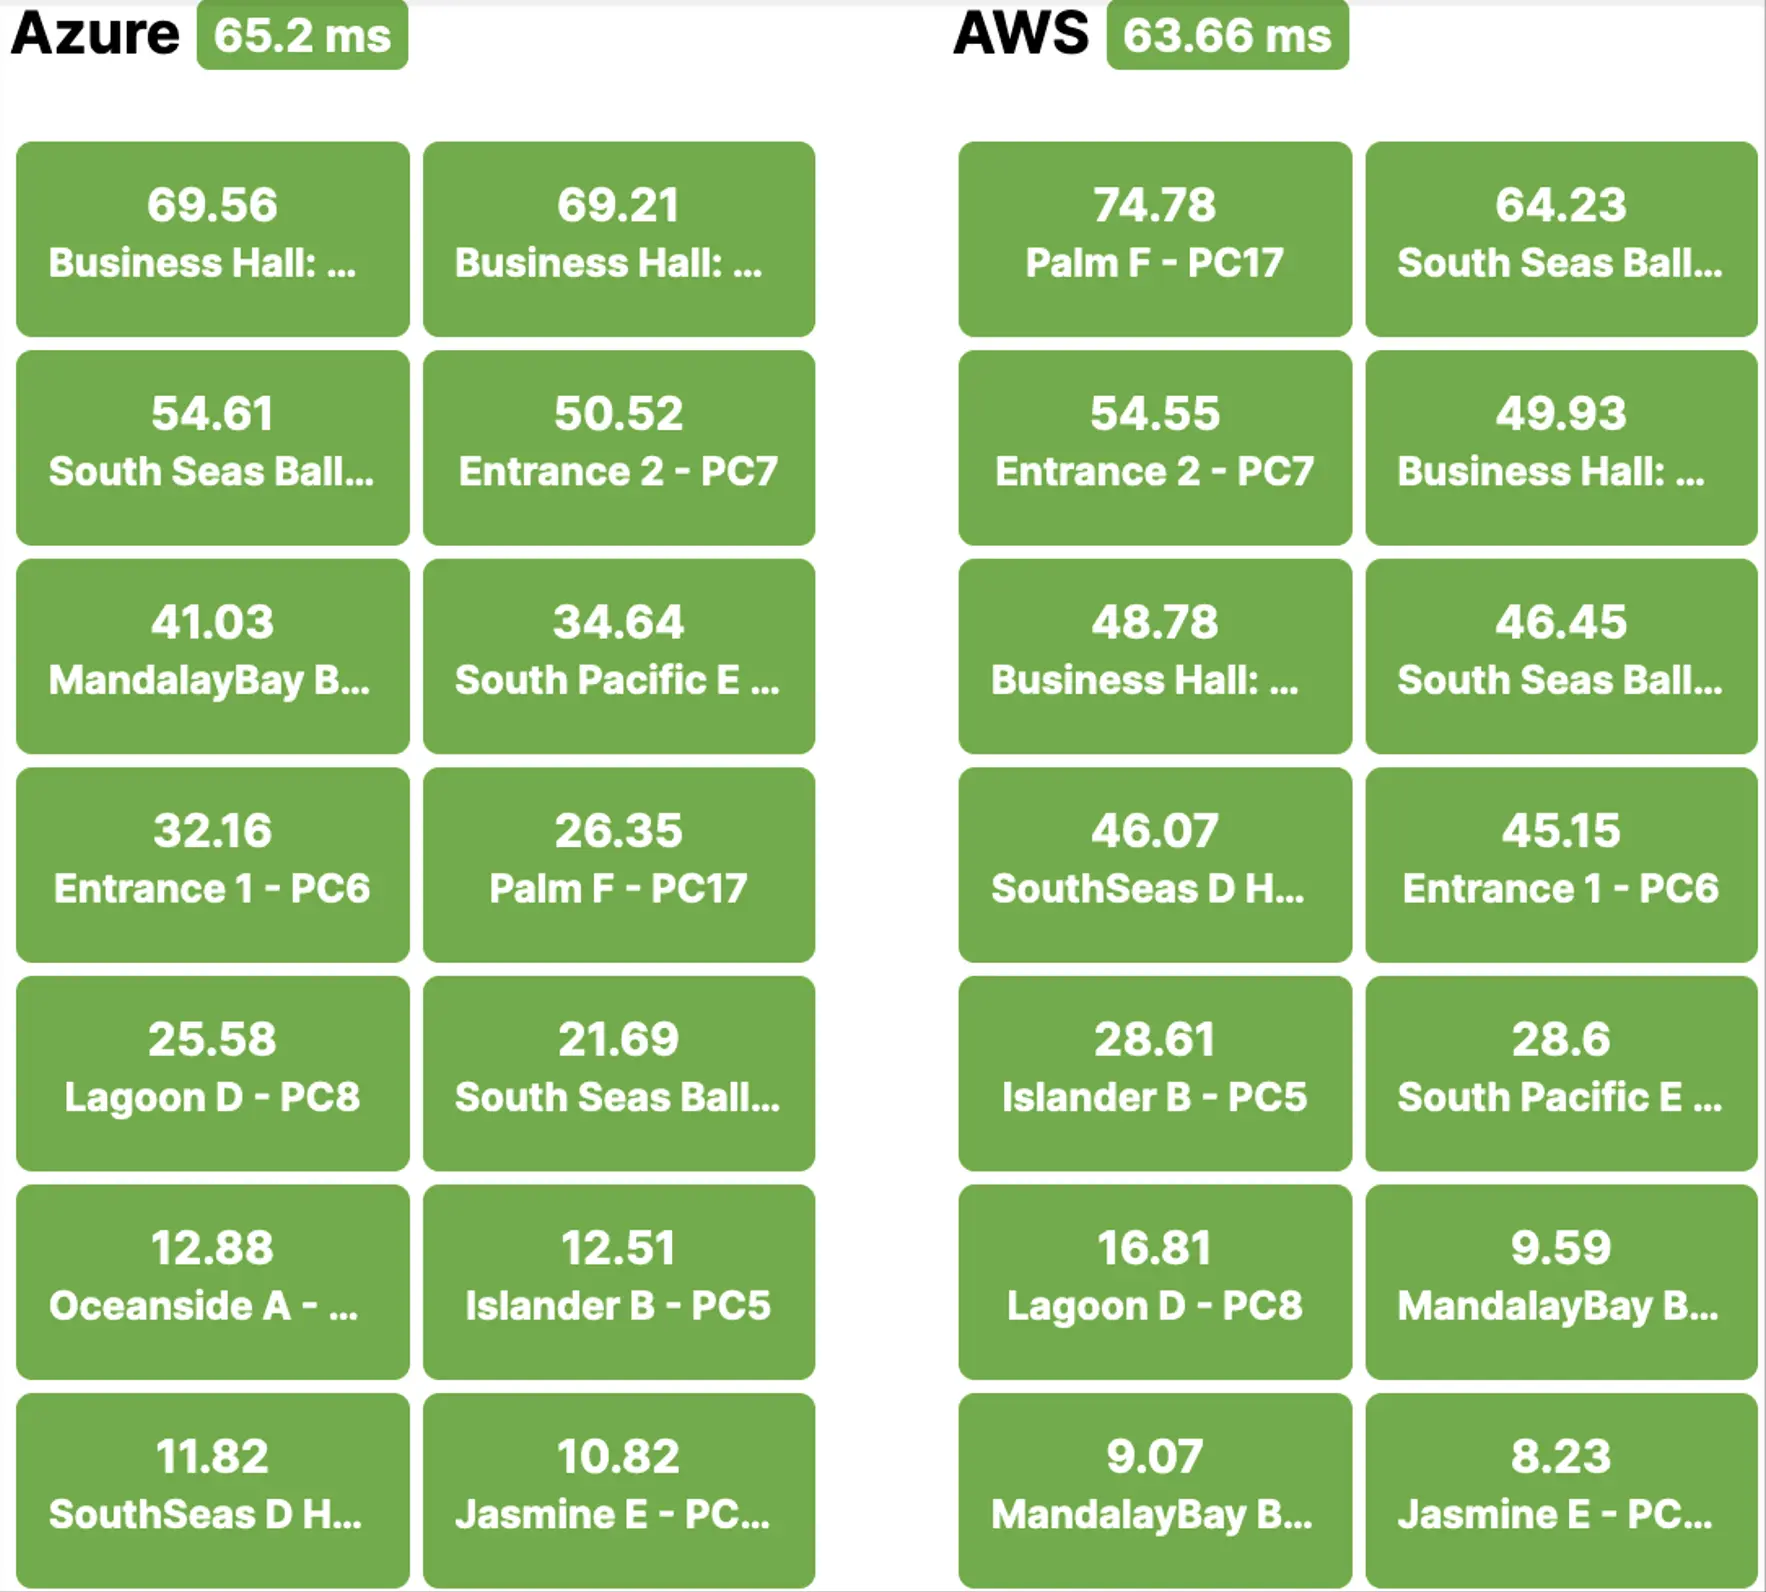
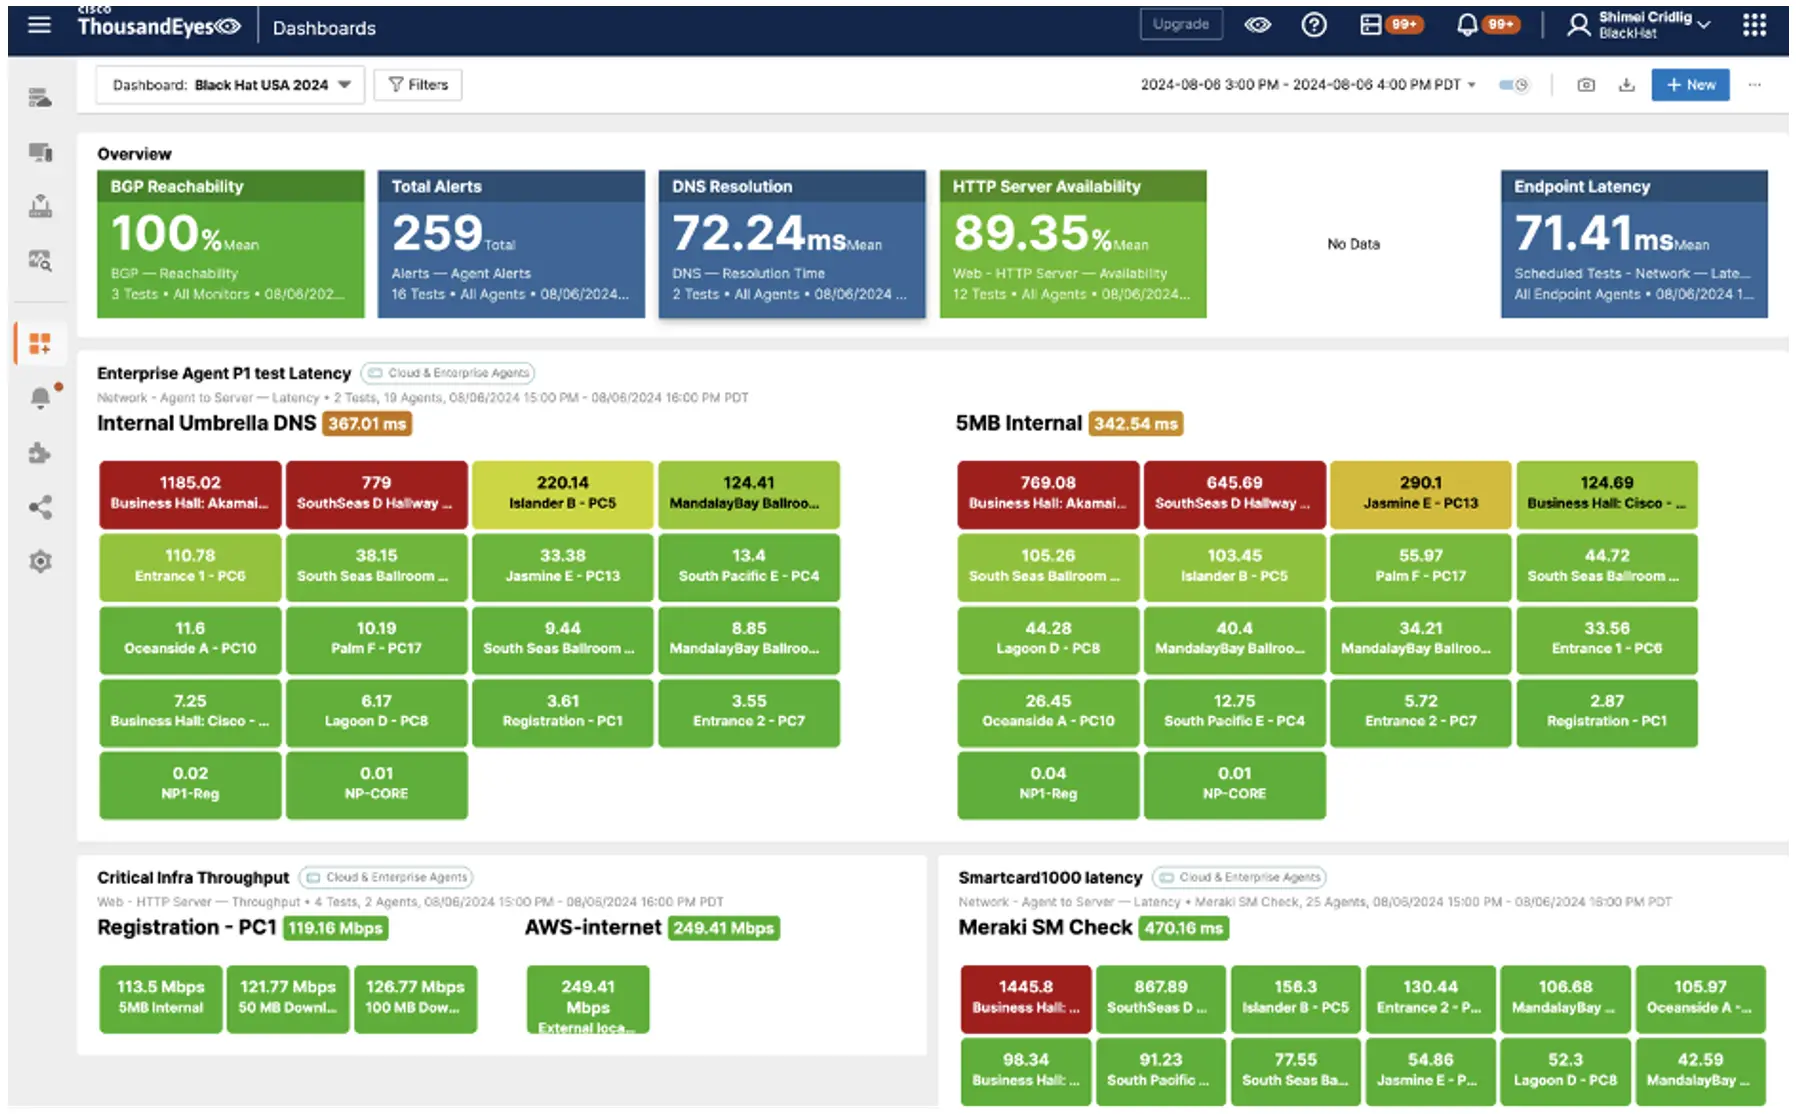
The dashboards in ThousandEyes allowed us to provide quick visual information that showed which conference rooms were experiencing the worst latency, alongside a comparison of latency across reporting rooms.
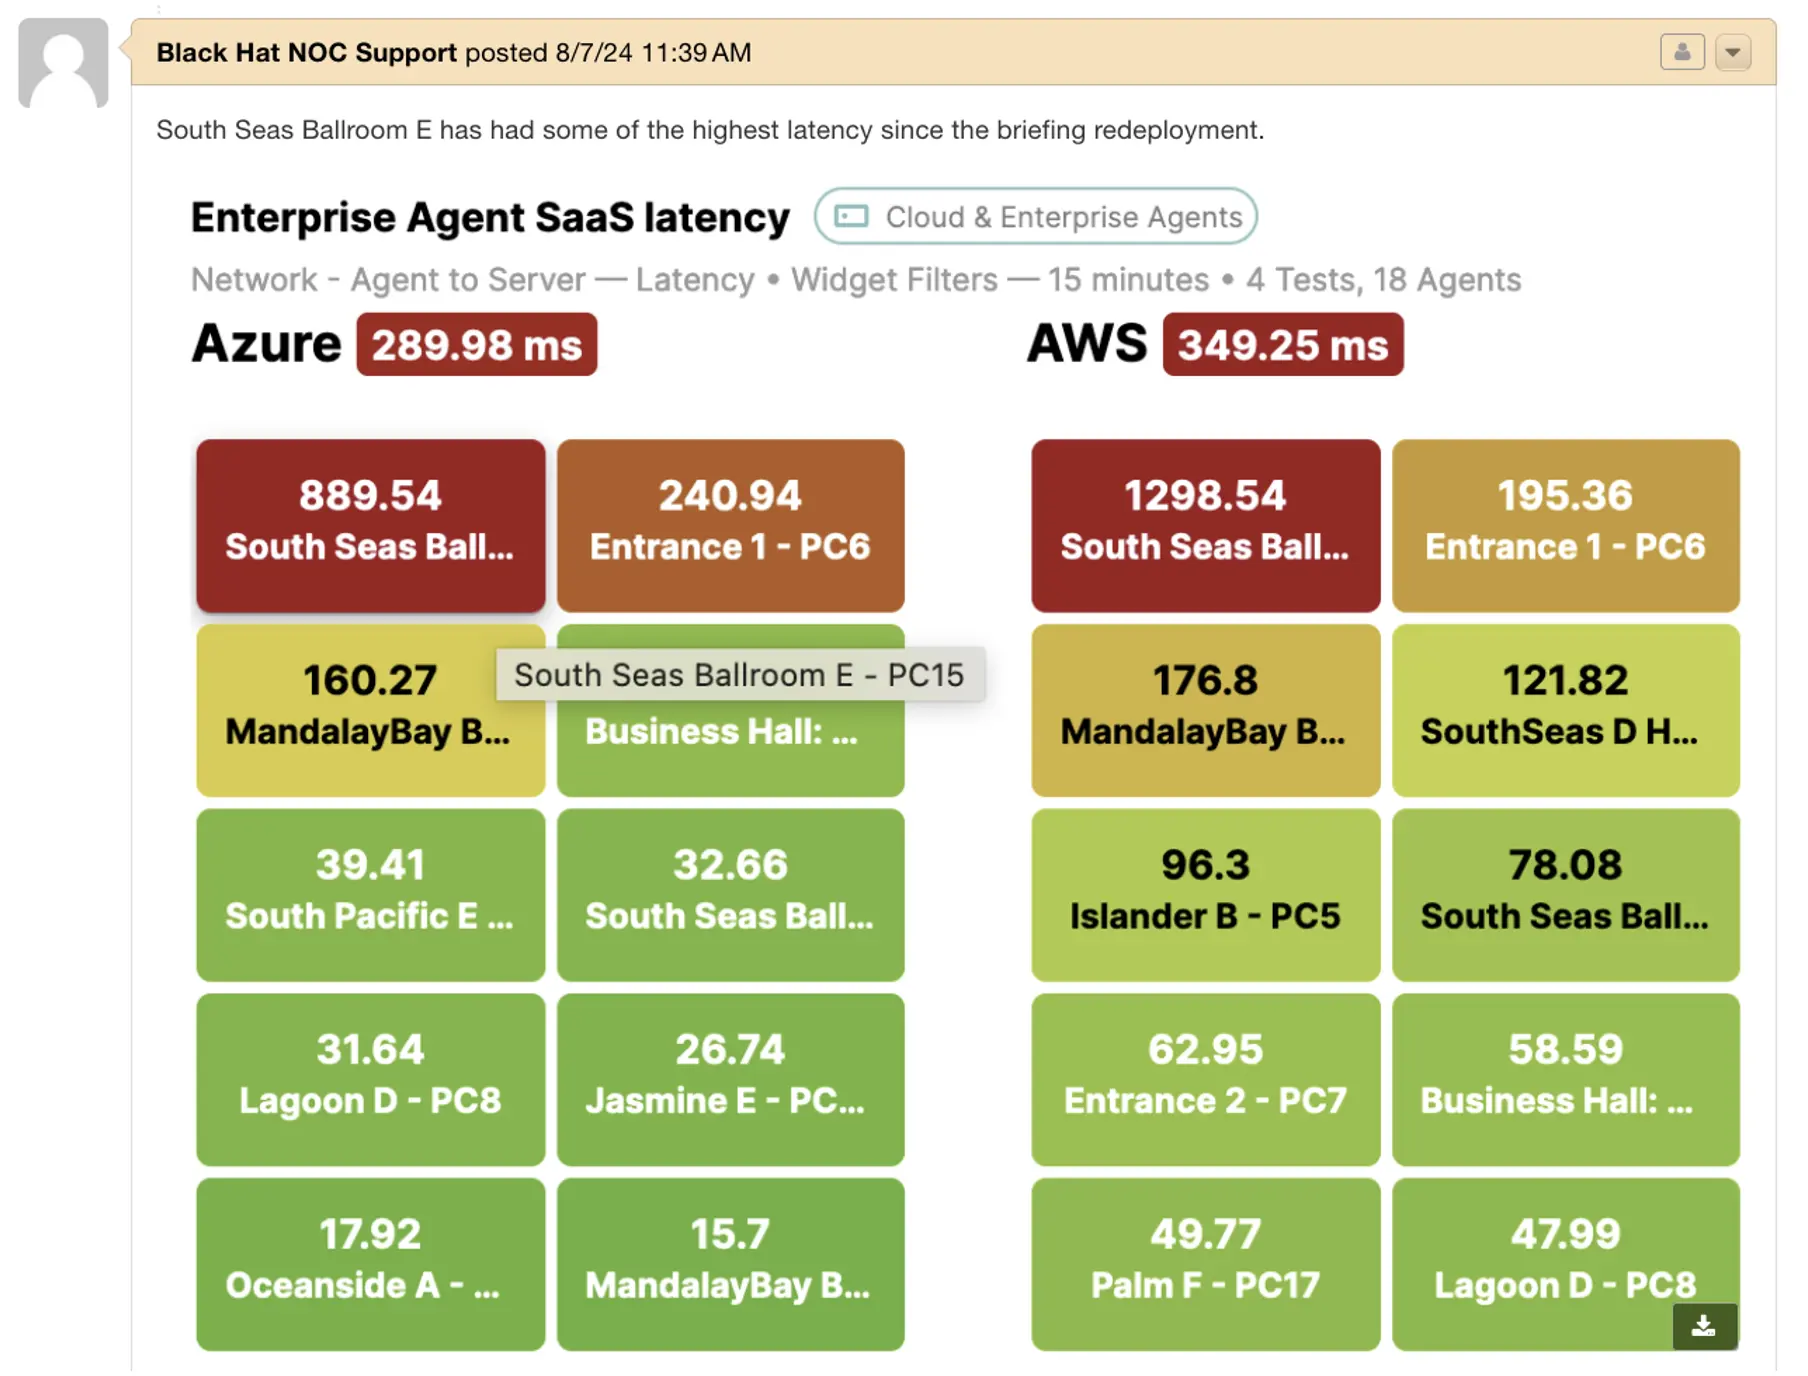
The automated reports behind each dashboard entry provided more granular information, including traffic path and the latency along each leg in the traffic path.
The new ticketing system allowed screenshots like the ones above to be aggregated in the ticket for team communication and record keeping.
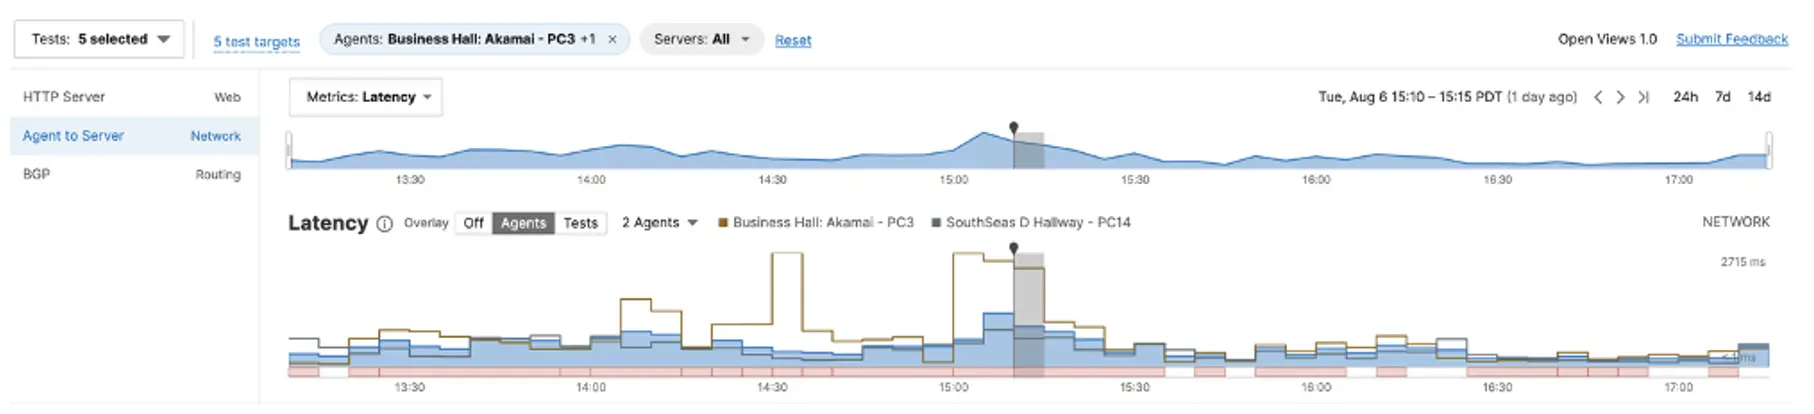
Troubleshooting WorkflowOn 08/06/2024 at 15:00, we observed high latency to our Internal Umbrella DNS test from the South Seas D Hallway and Business Hall Agents. Note that the links to the investigation views are provided as hyperlinks.
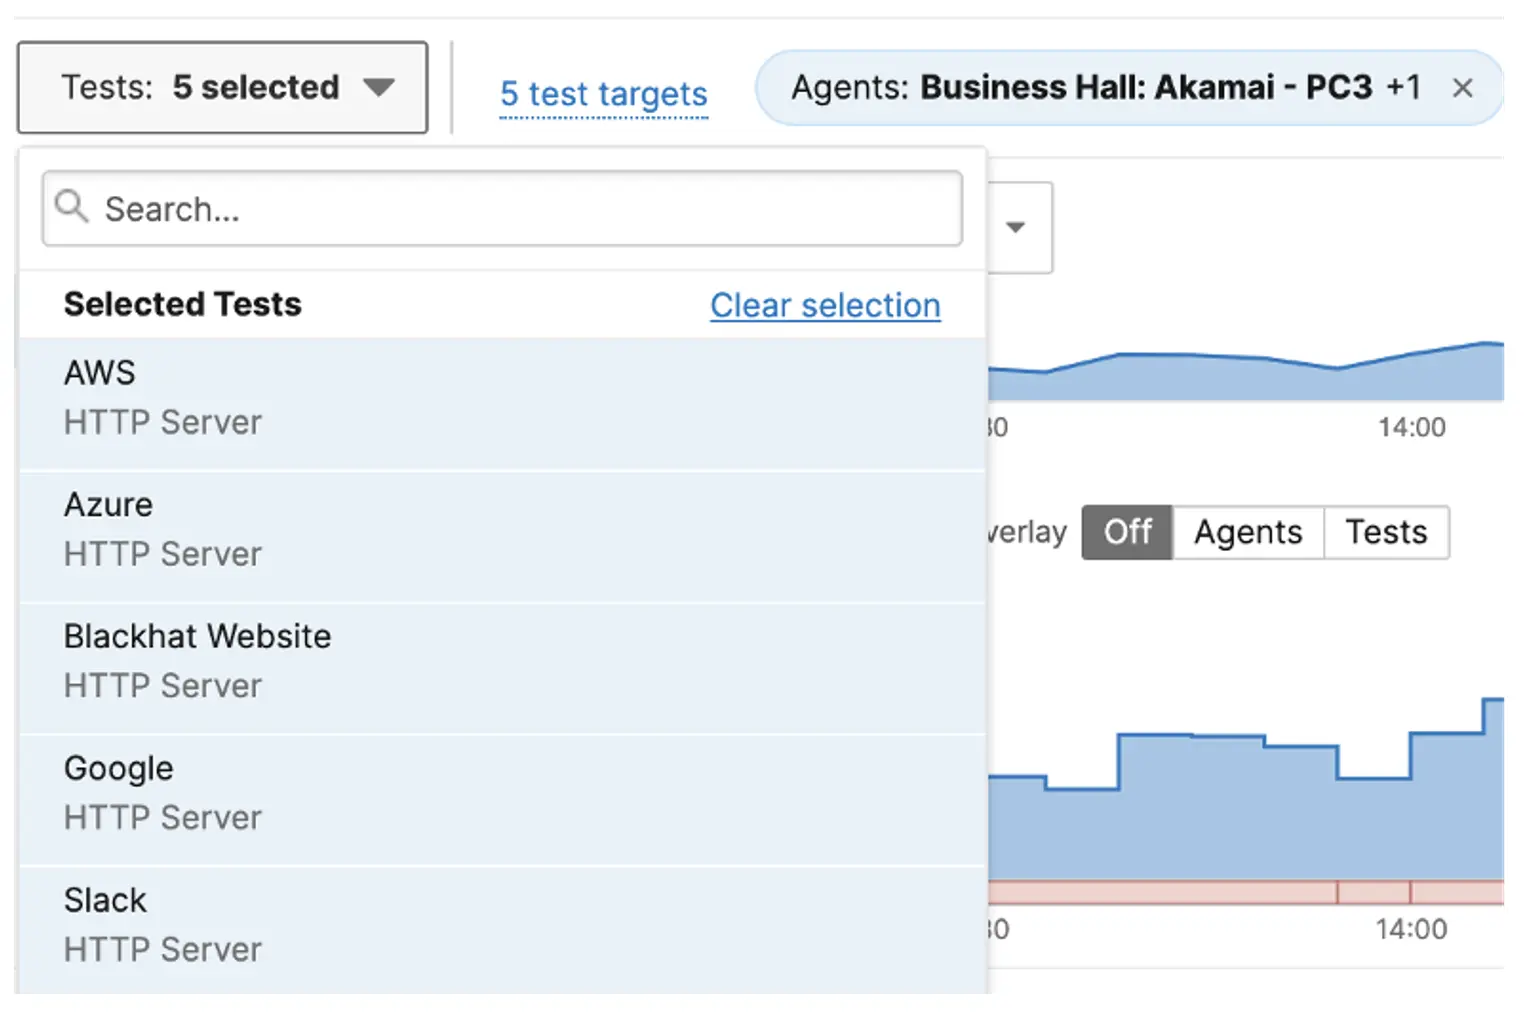
To narrow down the view, we used a dashboard filter to focus on the two Agents.
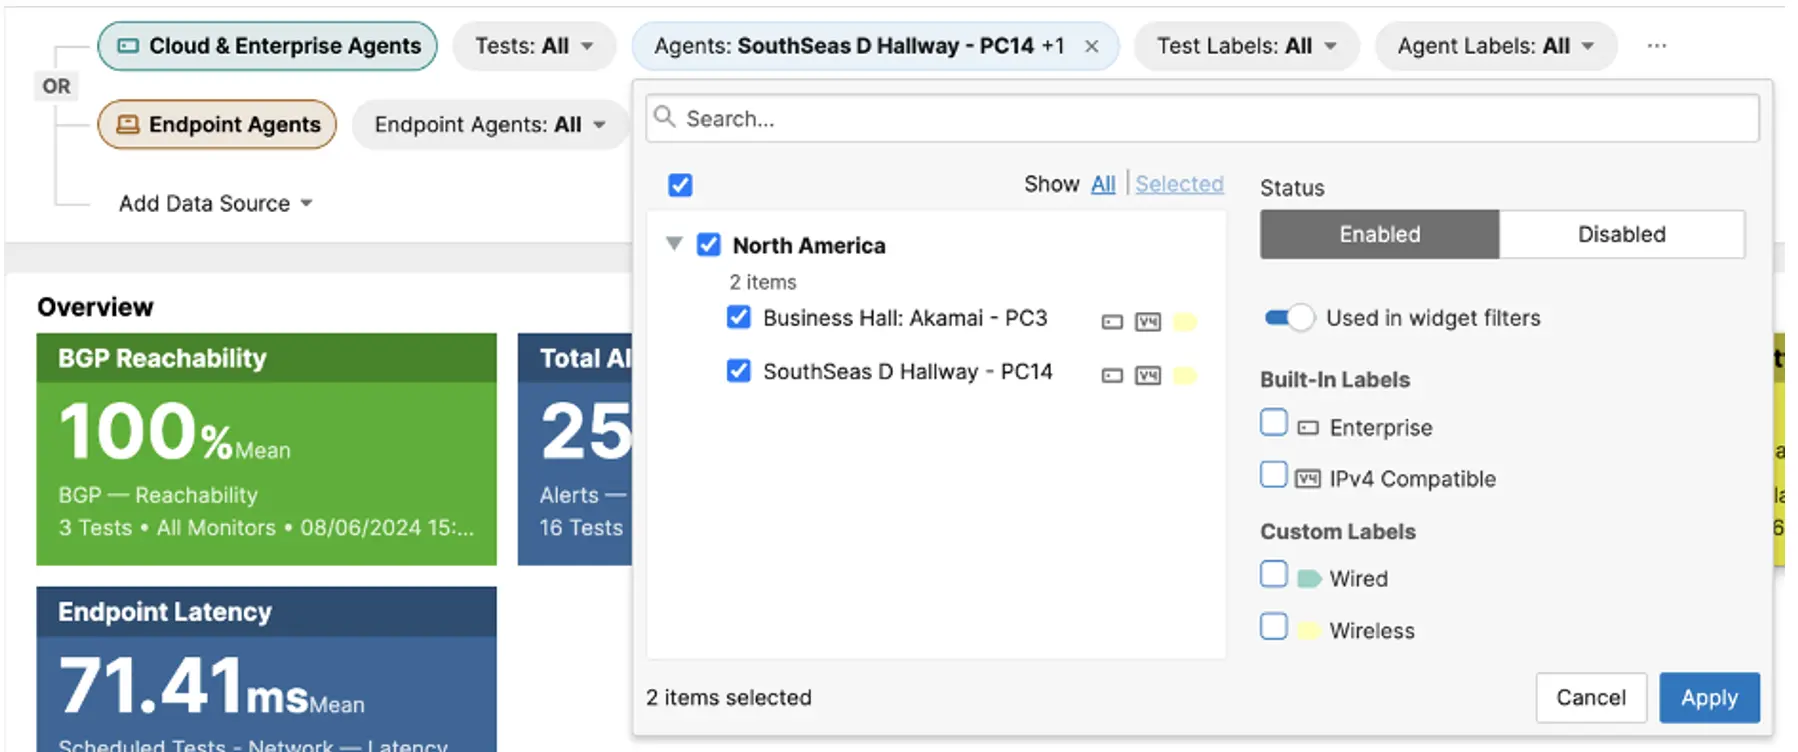
This confirmed the high latency observed by the two Agents extended across multiple tests.
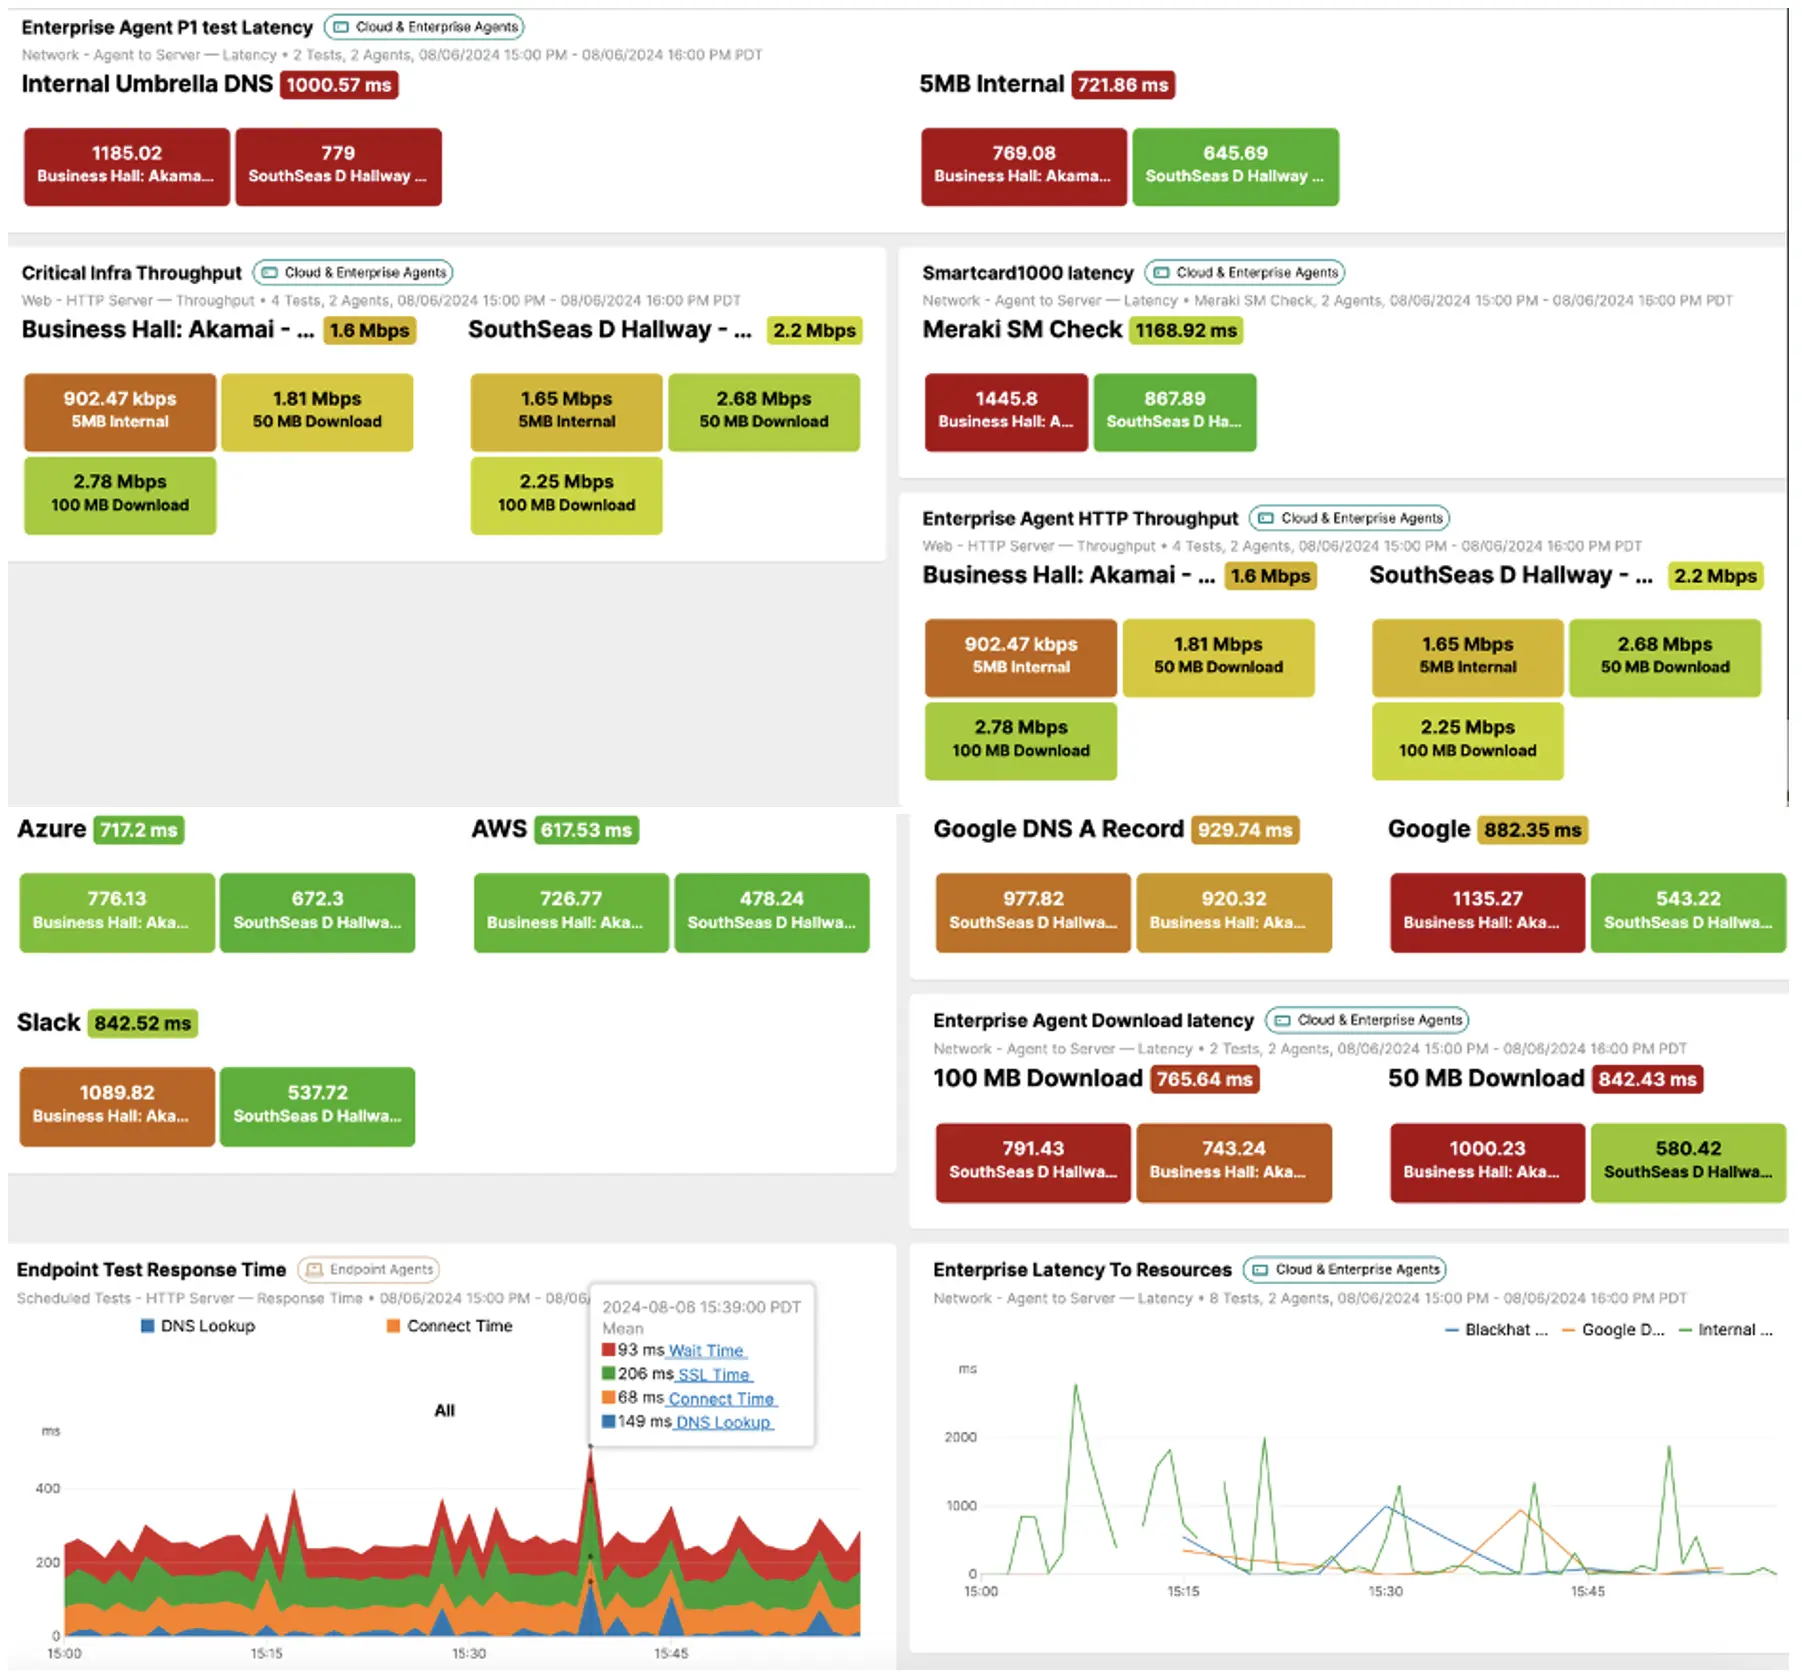
From here, we drilled down on each test to check the individual test results.
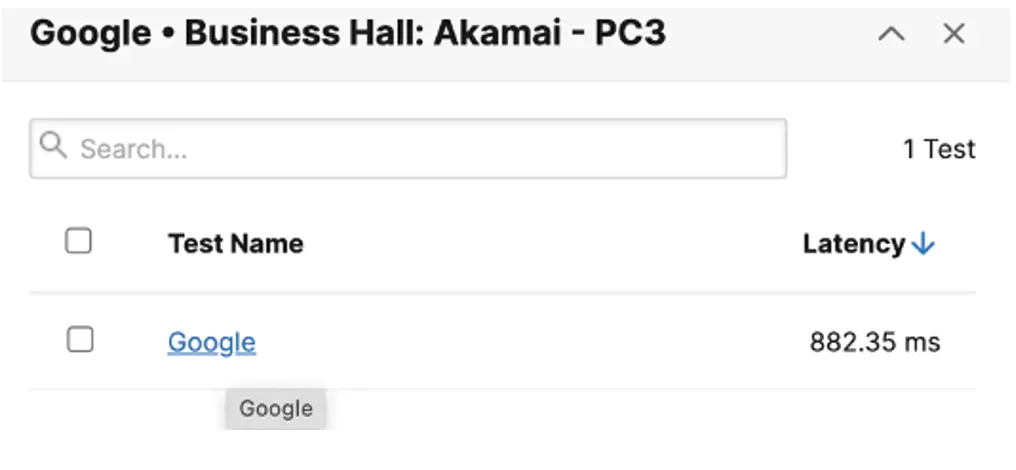
Within this view, we selected multiple tests running on both Agents and compared the results.
We observed that there was a latency spike reported by both Agents.
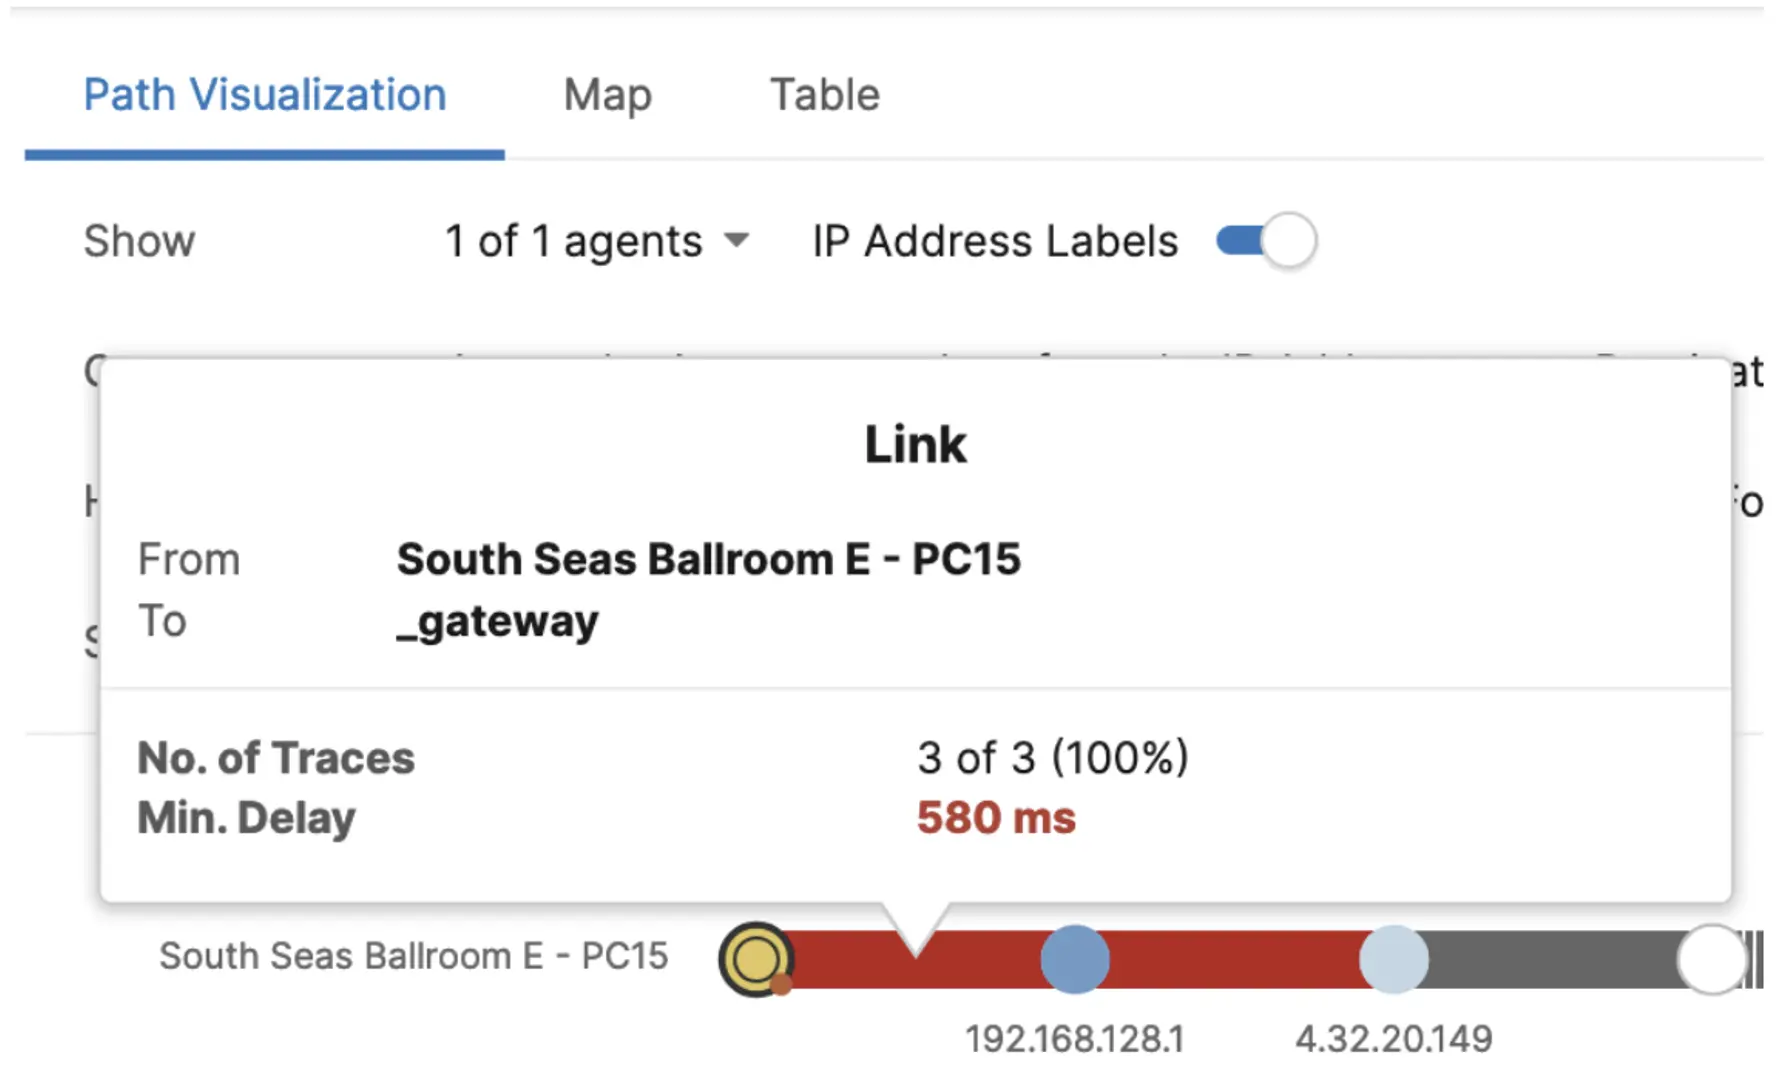
To understand the cause of the high latency, we drilled down to Path Visualization.
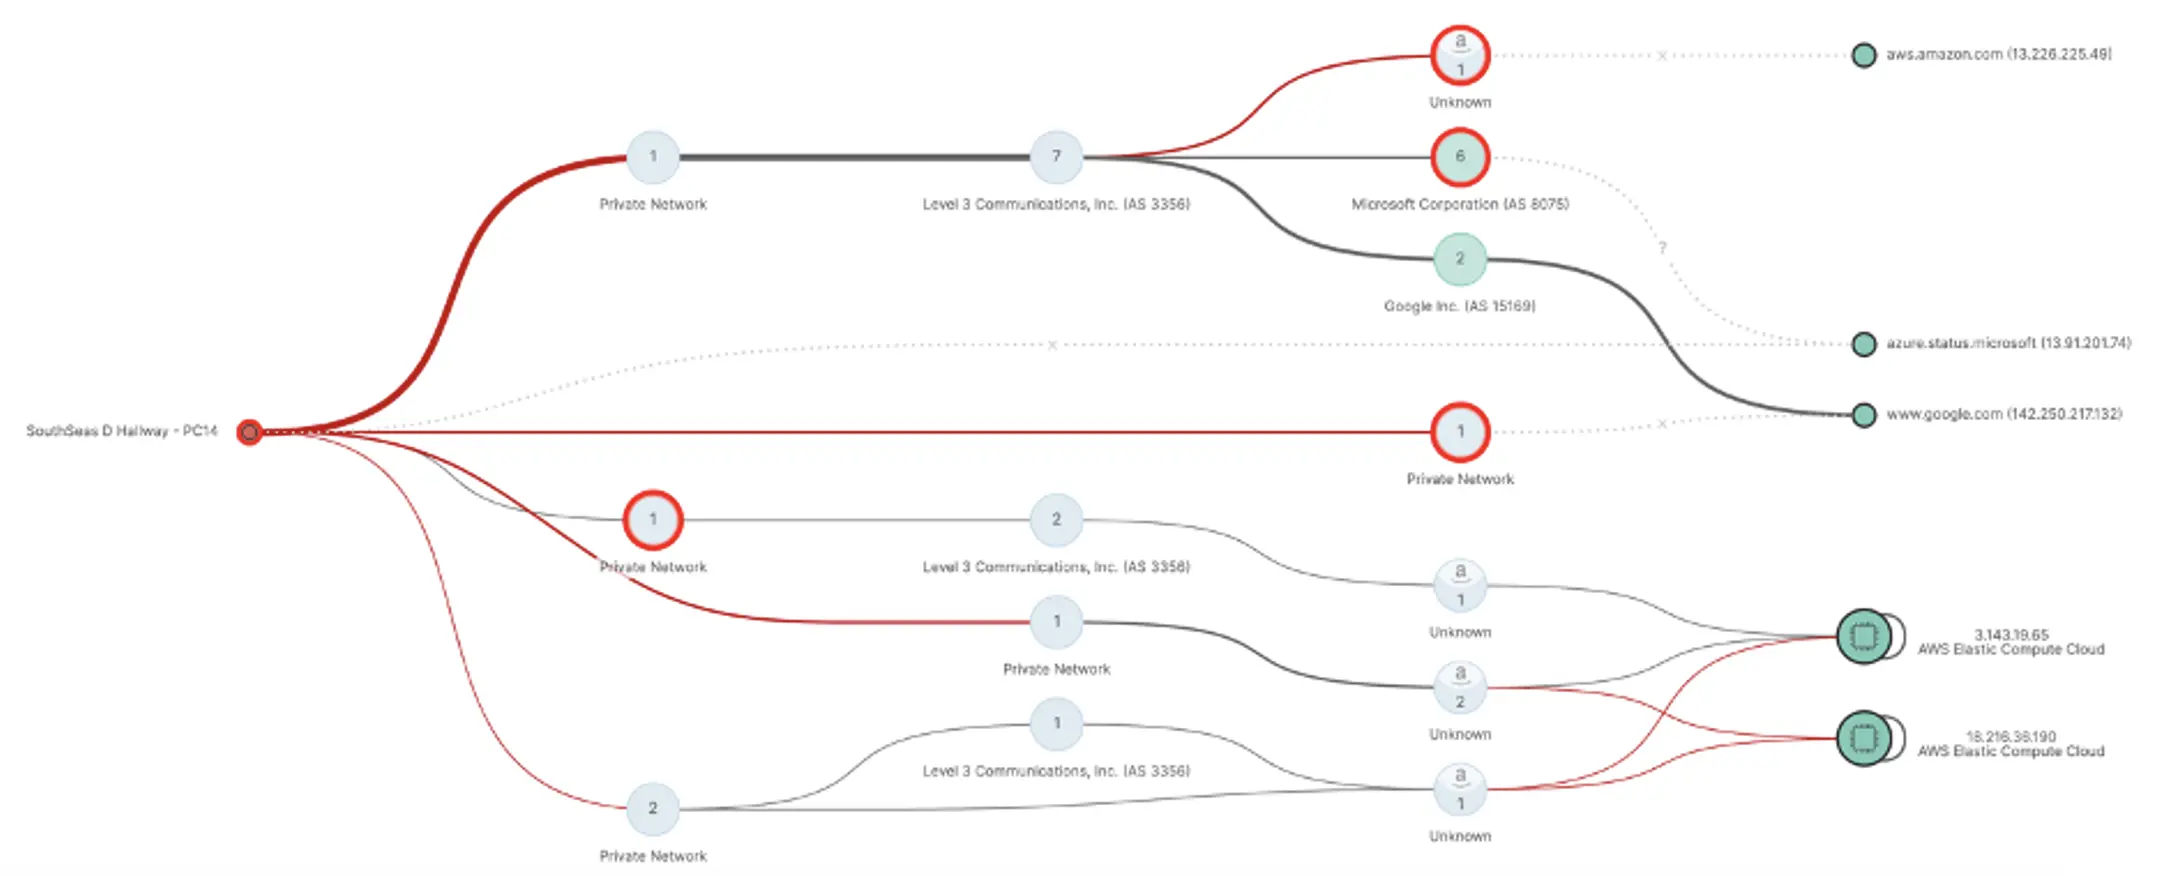
We noticed the high link delay between the Agent to its gateway. This indicates an issue either between the client and AP or between the AP and the server room with the router.
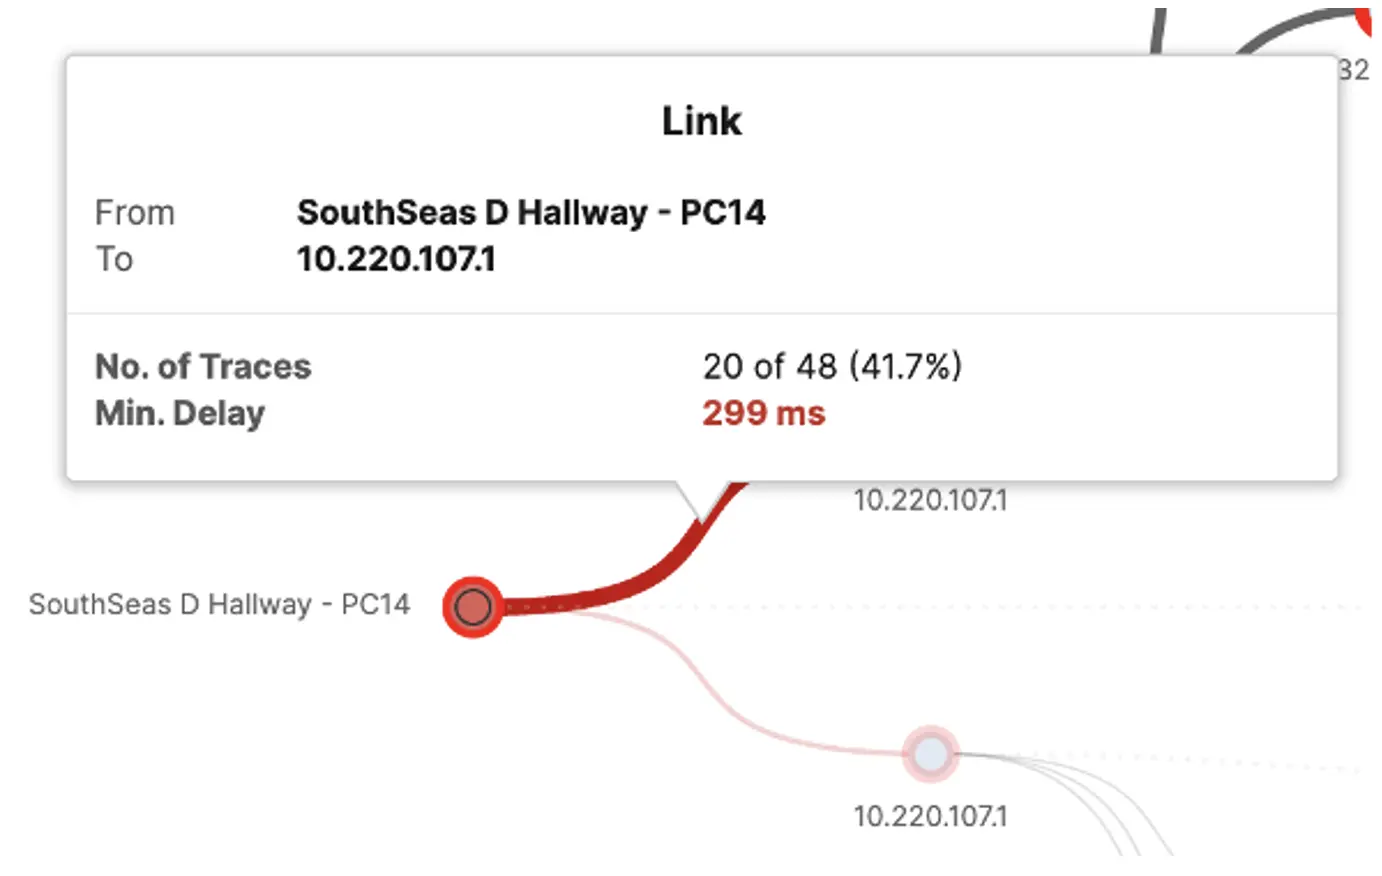
To confirm the cause of the latency, we visited South Seas D. We ran additional tests to confirm that the connection experience fit with the results reported by the Agent. Reviewing the room and topology diagrams further, we found that the AP covering South Seas D was placed in an adjacent room, and was broadcasting two SSIDs — one for the room it was placed in, and the other for South Seas D. The combination of the AP placement, the AP servicing two rooms, and the attendee volume in South Seas D combined to produce the latency observed by the Agent. These findings were shared with the wireless team.
Mobile device management at Black Hat: The role of Meraki Systems Manager
By: Dalton Ross
The Black Hat cybersecurity event in Las Vegas is renowned for its cutting-edge technology and seamless attendee experience. A critical component of this success lies in effective mobile device management (MDM). Since Black Hat USA 2021, we leveraged Cisco Meraki Systems Manager (SM) to handle a variety of tasks crucial to the event’s operations. Below is a detailed look at how the Meraki SM was deployed and the challenges faced along the way.
Essential roles of mobile devices at Black Hat
Mobile devices were pivotal in several key areas:
- Registration Kiosk iPad Devices (~50 Devices): Used at registration kiosks to streamline the attendee check-in process, where attendees scan a QR code for instant badge printing
- Session Scanning iPad Devices (~75 Devices): Deployed during Black Hat sessions to scan registered attendees into each session
- Lead Retrieval Devices (~800 Devices): A substantial number of devices were utilized on the show floor booths to swiftly collect booth visitor contact data
Planned deployment for Meraki Systems Manager
To ensure a smooth deployment, our strategy included several key steps:
- Pre-State with Apple Automated Device Enrollment (ADE): Before shipment to the event location, all devices were pre-staged using ADE. This allowed devices to be configured with a known SSID for faster deployment on site.
- Segregated Shipping: Devices were to be shipped in three distinct groupings, each corresponding to one of the roles. This aimed to facilitate swift deployment upon arrival.
- Dashboard Script for Role Association: A custom dashboard script was prepared to leverage the Meraki Dashboard API and easily associate enrolled devices with their respective roles.
- Automated Configuration Download: Once powered up, devices were expected to automatically download any necessary configurations or apps related to their role, making them ready for immediate deployment.
- Health Monitoring with Cisco ThousandEyes: ThousandEyes agents were to be deployed throughout the venue to log SM health at different event locations.
- Post-Event Factory Reset: After the event, all devices were to be factory erased before being returned.
Challenges and workarounds
As in life, challenges arose that required quick thinking and adaptation:
- Application List Changes: A last-minute change to the application list for session scanning devices was required. Although we initially planned to have all configurations ready beforehand, this unexpected change was efficiently managed using the Systems Manager with just a few clicks.
- ThousandEyes Agent Limitations: Since ThousandEyes agents were beta SM clients, they couldn’t accurately gather connectivity data. This was an anticipated behavior, but it posed a challenge for effective monitoring. To overcome this, NOC members from Cisco ThousandEyes and Cisco Meraki collaborated to hack together a proof of concept. Through hard work and several iterations, we configured the ThousandEyes agents to simulate device check-in traffic, mimicking valid SM clients.
Deploying Meraki Systems Manager at Black Hat was an intricate but rewarding endeavor. Despite facing challenges, our team demonstrated agility and innovation, ensuring the event’s operations ran smoothly. The experience underscored the importance of flexibility and quick problem solving in managing large-scale events.
By leveraging advanced MDM solutions like Meraki Systems Manager, we were able to provide a seamless experience for attendees and exhibitors alike, showcasing the power of technology in event management.
We are proud of the collaboration of the Cisco team and the NOC partners. Black Hat Europe will be December 9-12, 2024 at the London eXcel Centre.
Acknowledgements
Thank you to the Cisco NOC team:
- Cisco Secure: Christian Clasen, Matt Vander Horst, Aditya Sankar, Ben Greenbaum, Ryan Maclennan, Adam Kilgore, Shimei Cridlig, Shannon Wellington and Justin Murphy, with remote support by Jessica (Bair) Oppenheimer
- Meraki Systems Manager: Dalton Ross, with remote support by Paul Fidler and Connor Laughlin. Look for their report on The Meraki Blog.
Also, to our NOC partners:
- NetWitness (especially Alessandro Zatti)
- Palo Alto Networks (especially Jason Reverri and James Holland)
- Corelight (especially Dustin Lee)
- Arista (especially Jonathan Smith)
- Lumen and the entire Black Hat/Informa Tech staff (especially Grifter ‘Neil Wyler,’ Bart Stump, Steve Fink, James Pope, Mike Spicer, Sandy Wenzel, Heather Williams, Jess Stafford and Steve Oldenbourg)
About Black Hat
Black Hat is the cybersecurity industry’s most established and in-depth security event series. Founded in 1997, these annual, multi-day events provide attendees with the latest in cybersecurity research, development, and trends. Driven by the needs of the community, Black Hat events showcase content directly from the community through Briefings presentations, Trainings courses, Summits, and more. As the event series where all career levels and academic disciplines convene to collaborate, network, and discuss the cybersecurity topics that matter most to them, attendees can find Black Hat events in the United States, Canada, Europe, Middle East and Africa and Asia.
Share: