

The bull market of the 1980s and 1990s is the stuff dreams are made of.1
The S&P 500 was up nearly 18% per year over the course of those two decades.2
It’s one of the great bull markets in history.
But if we want to get picky, the bull market didn’t truly start until 1982. There were back-to-back recessions in 1980 and 1981-82. You had a 17% correction in 1980 along with a near-30% bear market that bottomed in 1982.
From the August 1982 bottom, which coincides with Paul Volcker declaring inflation was finally kicked, through the end of 1999, the S&P 500 was up an impressive 20% per year.
Now here’s the crazy part — the current bull market isn’t that far behind that epic run!
Take a look at how the bull market from the bottom in March 2009 stacks up against the 1980s and 1990s rager:
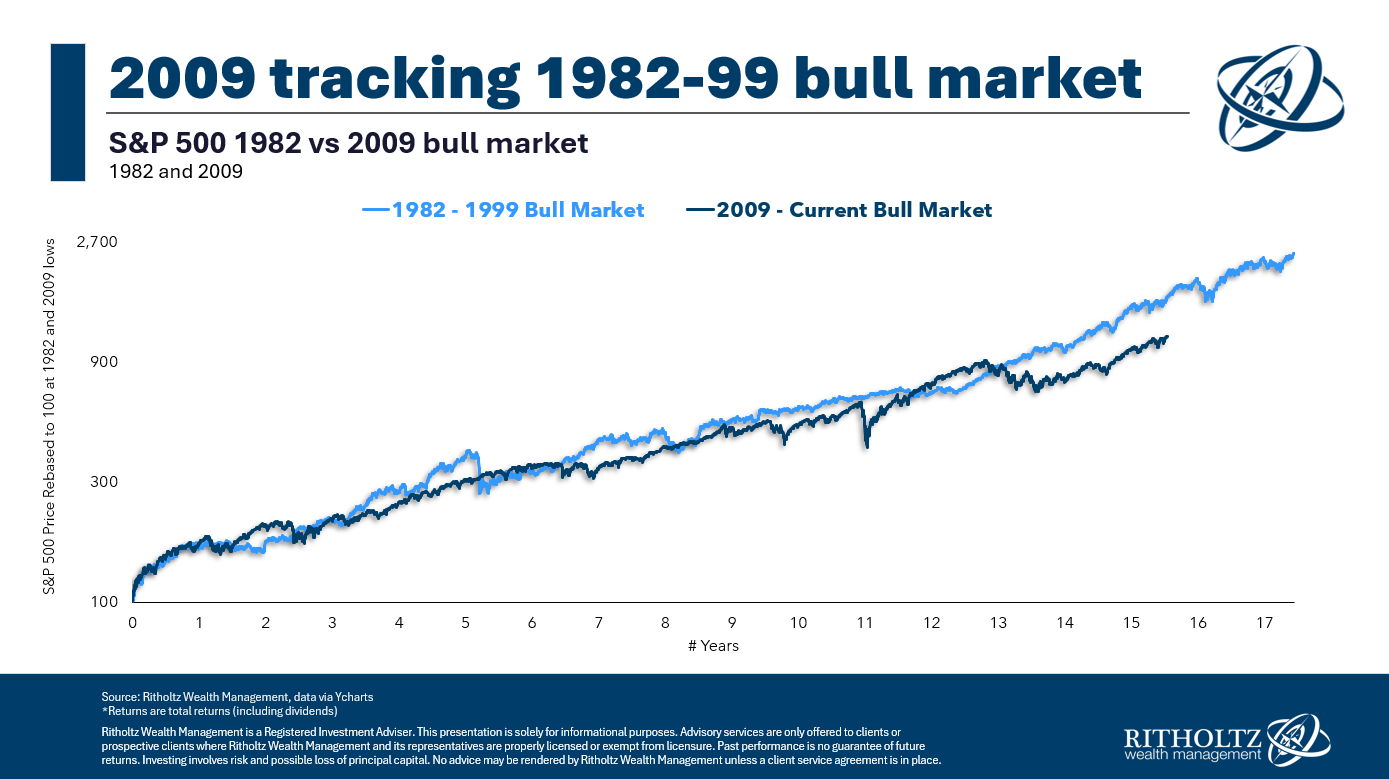
It’s much closer than you thought, right? I’ll admit, it’s closer than I expected.
From the GFC lows, the S&P 500 is now up almost 17% per year. So it’s not quite there but an AI-induced bubble could certainly get us there.
That previous bull market finished with a bang as the dot-com bubble took off at the end of the 1990s. From 1995-1999, the S&P 500 was up 37%, 23%, 33%, 28% and 21% in successive years.
That helped take it from a bull market to ludicrous speed.
Could we see that again if AI is as big as all of the tech luminaries claim? Maybe.
There are other similarities as well.
The 1987 crash saw the stock market fall 34% in a week. The Covid crash saw the market fall 34% over the course of a month.
And there was a soft landing in 1995 after the Fed initially rapidly raised interest rates.
I’m not always one for repeating and rhyming when it comes to the markets, but the magnitude and length of this bull market are getting more impressive each year.
Of course, it’s also worth noting what came after that bull market:
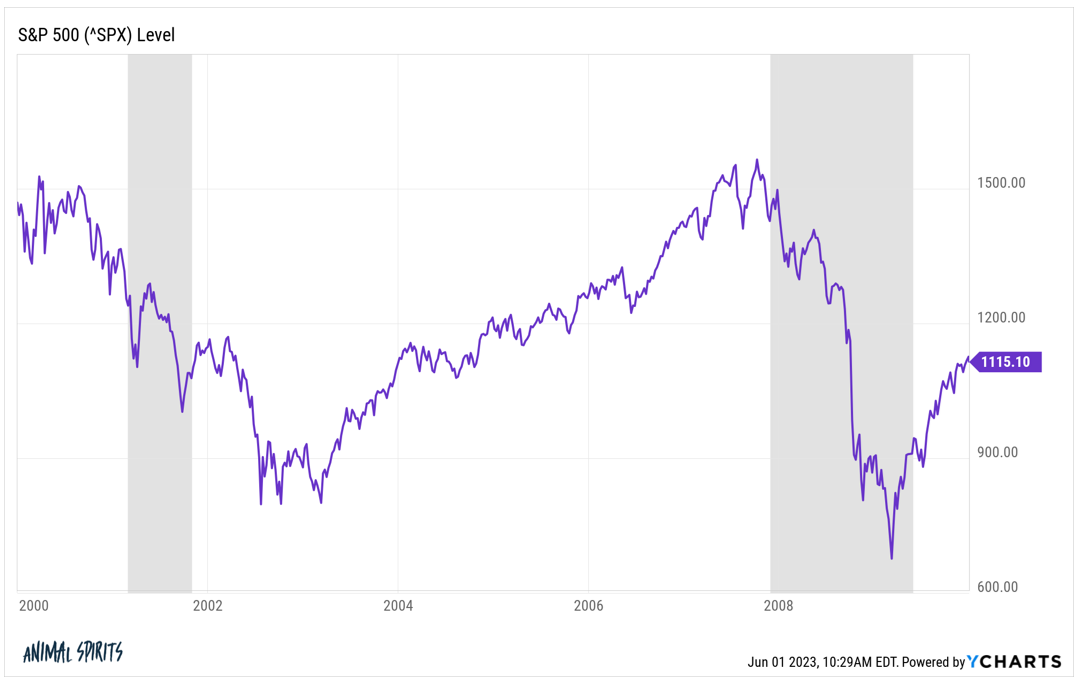
There was a lost decade from 2000-2009, book-ended by two of the biggest market crashes in history. Investors in the S&P 500 lost 10% in total over the first decade of the 21st century.
The U.S. stock market has a history of extended bull markets followed by lost decades.
The Roaring 20s ushered in one of the biggest booms in history.
That was followed by a lost decade in the 1930s and beyond.
From the end of World War II through the mid-1960s, there was an extended bull market (with some hiccups along the way).
From the late-1960s through the early-1980s, the stock market went nowhere again (after inflation).
Then came the 80s and 90s bull run, which was followed by a lost decade, which was followed by the current bull market.
Are we due for another period where the stock market goes nowhere?
Maybe. It wouldn’t surprise me.
Just know that we’re living through an epic bull market.
Enjoy it while you can.
Michael and I talked new all-time highs, bull markets and much more on this week’s Animal Spirits video:
Subscribe to The Compound so you never miss an episode.
Further Reading:
Could We See Another Lost Decade in the U.S. Stock Market?
Now here’s what I’ve been reading lately:
Books:
1The best book ever written about this two-decade-long run is Bull: A History of the Boom & Bust by Maggie Mahar. I highly recommend it for any other armchair market historians out there.
2The biggest difference between that bull market and this one is bond market returns. Ten year treasuries were up a ridiculous 9.6% per year from 1980-1999. From the bottom in 2009, treasuries are up more like 2.5% per year.
This content, which contains security-related opinions and/or information, is provided for informational purposes only and should not be relied upon in any manner as professional advice, or an endorsement of any practices, products or services. There can be no guarantees or assurances that the views expressed here will be applicable for any particular facts or circumstances, and should not be relied upon in any manner. You should consult your own advisers as to legal, business, tax, and other related matters concerning any investment.
The commentary in this “post” (including any related blog, podcasts, videos, and social media) reflects the personal opinions, viewpoints, and analyses of the Ritholtz Wealth Management employees providing such comments, and should not be regarded the views of Ritholtz Wealth Management LLC. or its respective affiliates or as a description of advisory services provided by Ritholtz Wealth Management or performance returns of any Ritholtz Wealth Management Investments client.
References to any securities or digital assets, or performance data, are for illustrative purposes only and do not constitute an investment recommendation or offer to provide investment advisory services. Charts and graphs provided within are for informational purposes solely and should not be relied upon when making any investment decision. Past performance is not indicative of future results. The content speaks only as of the date indicated. Any projections, estimates, forecasts, targets, prospects, and/or opinions expressed in these materials are subject to change without notice and may differ or be contrary to opinions expressed by others.
The Compound Media, Inc., an affiliate of Ritholtz Wealth Management, receives payment from various entities for advertisements in affiliated podcasts, blogs and emails. Inclusion of such advertisements does not constitute or imply endorsement, sponsorship or recommendation thereof, or any affiliation therewith, by the Content Creator or by Ritholtz Wealth Management or any of its employees. Investments in securities involve the risk of loss. For additional advertisement disclaimers see here: https://www.ritholtzwealth.com/advertising-disclaimers
Please see disclosures here.