

A reader asks:
My wife and I are in our late 30s and hoping to retire at 60, when we can begin withdrawing from our retirement accounts penalty-free. Our plan is to let our current stock portfolio, which is valued at approximately $650K, ride for that 22 year period, while continuing to max out our Roth IRAs annually. Let’s say that the stock market’s average annual rate of return, when adjusted for inflation, is around 7%. We can therefore estimate that our portfolio, when we retire at age 60, will be about $3.6 million (in today’s dollars). A more conservative 6% rate of return yields a portfolio of $3 million. Of course we’re not guaranteed a 7% or even a 6% annual rate of return, especially when looking out over a few years. My question is, based on historical data, how confident can we be that over a 22 year period we’ll get an annual rate of return that approaches the average rate of let’s say 7%. In stock market history, what is the worst annual rate of return over a 22 year period? What percentage of 22 year periods have an annual rate of return that is at least 6%?
Some people might look at this as homework. I look at is as a challenge.
This question is definitely in the Ben Carlson wheelhouse. What can I say — I’m a sucker for market history and retirement scenario planning.
A few things I like about this question:
- I like how they’re thinking in real terms since inflation can add up over the decades.
- I like how they’re thinking about inflatin adjusted returns since spending is what matters during retirement.
- I like how they’re thinking in terms of both baseline and worst-case scenarios. It’s important to look at a range of outcomes when setting expectations.
- I like how they’re thinking long-term in their late 30s.
Let’s go to the data!
From 1926 through June 2024, the S&P 500 had compounded at an inflation-adjusted return of 7.2% per year. That’s a pretty darn good average. Real returns have not been this high in most other countries but the winners write the stock market history books, as they say.
Here’s a look at the rolling 22-year real annual returns for the S&P 500:
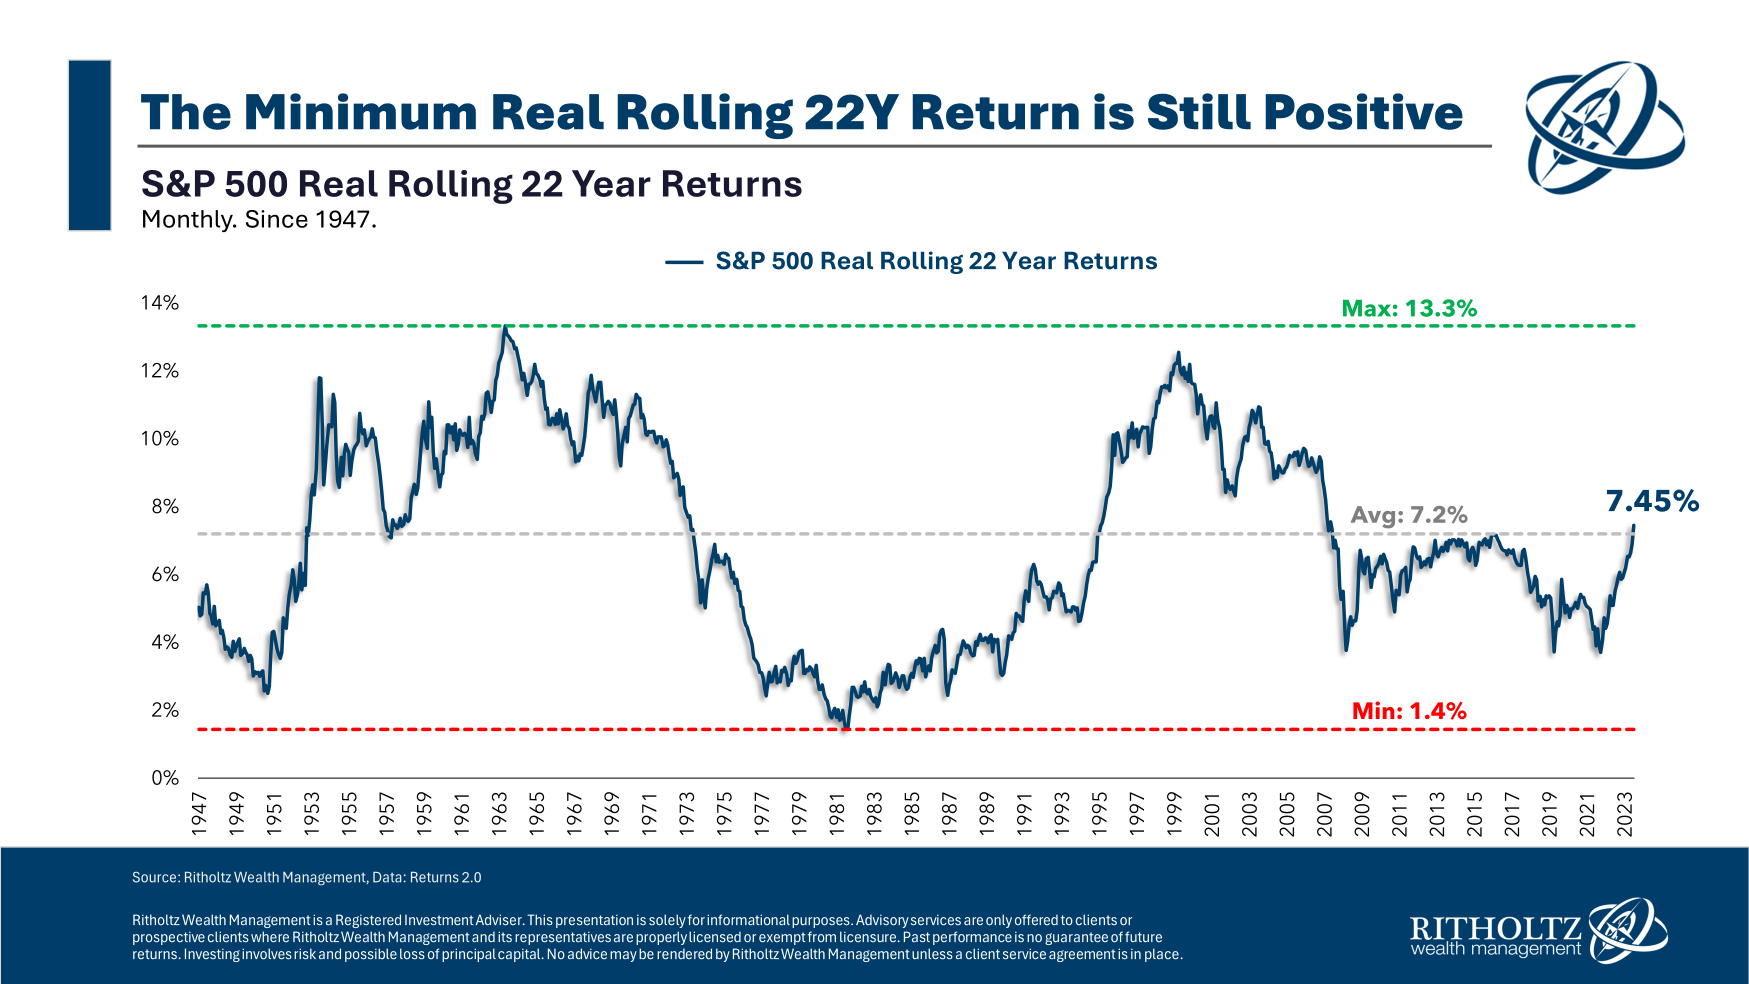
Surprisingly, the worst 22 year period for real returns was not in the aftermath of the Great Depression but rather in the 1970s. The two-plus decade real return ending in the summer of 1982 was just 1.4% per year. That time frame featured an annual inflation rate of nearly 6% which is a high hurdle rate to beat.
The best return came in the period leading up to that high inflation, with a 13.2% real annual return ending in the spring of 1964. The period after the 1970s debacle also produced wonderful real returns, with close to 13% annual inflation-adjusted gains ending March 2000.
As always, markets are cyclical.
The most recent period ending June 2024 was close to the long-term average at 7.5% real annually.
The good news is that real returns have not been negative over the past ~100 years. The bad news is that there can be a wide range of results, even over the long run.
Here are the historical win rates at different annual real return levels:
- At least 3% (92% of the time)
- At least 4% (80% of the time)
- At least 5% (71% of the time)
- At least 6% (59% of the time)
- At least 7% (45% of the time)
- At least 8% (40% of the time)
The future doesn’t have to look like the past, but even if we use history as a guide, high real returns are not a sure thing.
In two out of every five instances, real returns were less than 6% over these rolling 22-year periods. In my book, a 4-5% real return is pretty decent, and those levels were hit more often than not.
However, risk exists in the stock market, even with a time horizon of two-plus decades.
This is what makes retirement planning so difficult. There are all kinds of unknowns to deal with, returns being one of the most nerve-racking.
When planning for a multi-decade time horizon it’s important to:
- Set baseline expectations with the understanding they are educated guesses.
- Update your plans as those expectations do or do not become reality.
- Include a margin of safety in the planning process.
- Make course corrections along the way when needed.
Investment planning would be much easier if you were promised a specific rate of return but financial markets don’t work like that.
You have to make reasonable decisions in the present about an unknowable future and be flexible enough to adapt when things don’t go as planned.
That’s not the precise answer most people would like to hear but financial planning does not come with 100% precision.
And if you’re planning for retirement in your late 30s, you’re not bound to a 22-year time horizon.
You can work longer or save more or change plans if necessary.
I broke down this question on the latest Ask the Compound:
My colleagues Dan LaRosa and Cameron Rufus joined me on the show this week to discuss questions about how to find the best auto insurance rates, owner-only defined benefit plans, finding clients as a financial advisor and how much of your portfolio should be in alternative investments.
Further Reading:
When is Mean Reversion Coming in the Stock Market