

Four charts about the economy you might find surprising:
1. Wages are cumulative too. The Congressional Budget Office released new research comparing inflation on a basket of goods and services households at different income levels consume between now and 2019 along with changes in wages.
Here’s the chart:

And the explanation:
For households in every quintile (or fifth) of the income distribution, the share of income required to pay for their 2019 consumption bundle decreased, on average, because income grew faster than prices did over that four-year period.
People are quick to point out that the current 3.5%-ish inflation rate is deceiving because the inflation since the pandemic is cumulative.
Guess what else is cumulative? Wages, which have increased even more than prices, on aggregate.
If you want an explanation for the continued strength of the consumer and the economy, look no further than higher wages.
When people make more, they tend to spend more.
2. Young people are better off than their parents. For years, pundits have been complaining about the fact that so many young people are worse off than their parents’ generation at the same age.
The Economist shared research from a new paper that disputes this claim.
Here’s the chart:

And the explanation:
A new paper by Kevin Corinth of the American Enterprise Institute, a think-tank, and Jeff Larrimore of the Federal Reserve assesses Americans’ household income by generation, after accounting for taxes, government transfers and inflation. Millennials were somewhat better off than Gen X–those born between 1965 and 1980–when they were the same age. Zoomers, however, are much better off than millennials were at the same age. The typical 25-year-old Gen Z-er has an annual household income of over $40,000, more than 50% above baby-boomers at the same age.
Each generation has seen higher inflation-adjusted wages than their parents.
Every young generation has challenges, and today is no different.1
This doesn’t mean everyone is better off but median incomes for Gen Z are higher than millennials at the same age, which were higher than Gen X at the same age which were higher…you get the picture.
This is progress.
3. Large corporations aren’t feeling inflation’s impact. Consumers hate inflation. Small businesses aren’t a fan. Politicians don’t like it much either.
But large corporations?
They seem just fine when it comes to profit margins.
Here’s the chart:
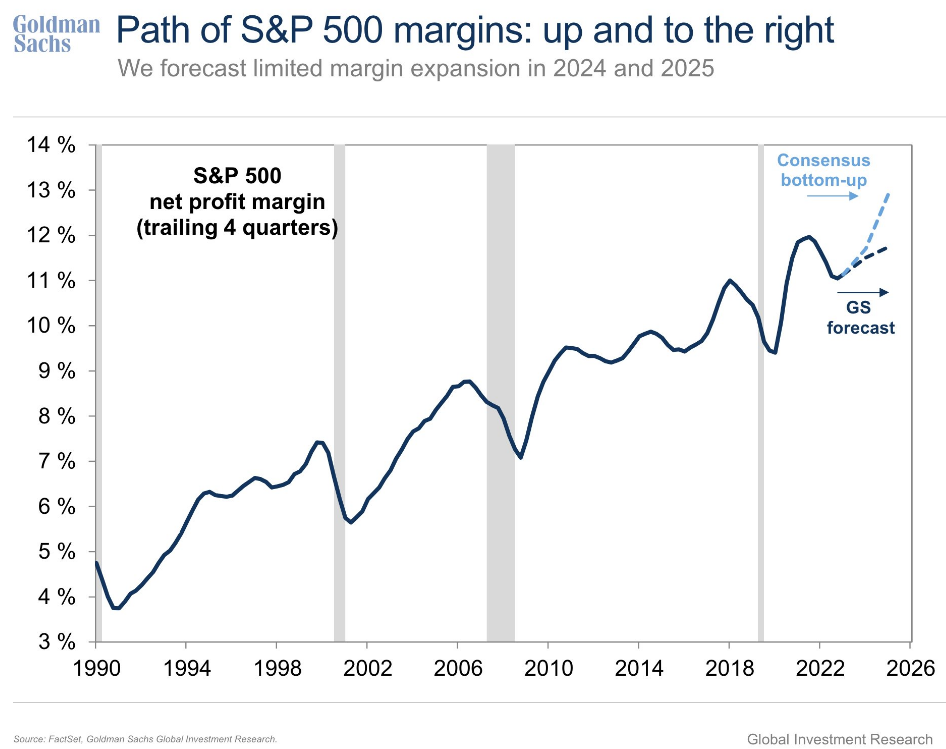
And the explanation:
Corporations are paying higher wages and input costs but they simply raised prices to combat those higher costs.
Corporate America puts profit first, second, and third, which is one of the reasons the stock market is so resilient.
If it seems like corporations always win it’s basically true. They know how to adapt regardless of the macro environment.
That’s why profit margins have only improved during the highest inflation in four decades.
4. The United States is the world’s leading oil producer. When Russia invaded Ukraine in the spring of 2022, the price of oil quickly shot up from around $90/barrel to $120/barrel.
Energy experts and macro tourists alike came out with $200/barrel predictions. It made sense at the time!
That war still rages on, along with an additional conflict in the Middle East. In the past, this would have sent oil prices skyrocketing. The oil crisis was a big reason we had stagflation in the 1970s.
Not this time around. Oil prices are back down to $80/barrel. On an inflation-adjusted basis, oil prices are essentially flat since 2019 just before the pandemic.
Considering the macro and geopolitical environment, I never would have believed this would be the case yet here we are.
Why is this the case?
Here’s the chart (via Torsten Slok):

And the explanation:
This is one of the main reasons we neve got $200 oil.
The U.S. becoming the biggest oil producer in the world is one of the most important macro developments of the past 20-30 years, yet you rarely hear about it.
This is a huge deal!
As bad as inflation has been these past few years, it could have been far worse had oil gone above $150/barrel, which would have sent gas prices to something like $6 a gallon.
The post-pandemic economy has been stronger than most people predicted.
Higher wages, higher profit margins and lower oil prices are all a big reason for this.
It could have been a lot worse.
Further Reading:
Inflation at the Grocery Store
1Today, we have a historically unaffordable housing market for young people. I will be curious to see what happens when these higher wages compete with higher housing prices. You could make the case this will put a floor under housing prices if young people plug their noses and keep buying.